Introduction
Shelfwise is an inventory demand forecasting tool that helps you predict what your shelves need next. Upload your historical sales data, generate AI-powered forecasts for any product, and make smarter restocking decisions — all without complex spreadsheets or data science expertise.
This guide walks you through every feature: from creating your account and uploading data, to interpreting forecast results and sharing them with your team.
Getting Started
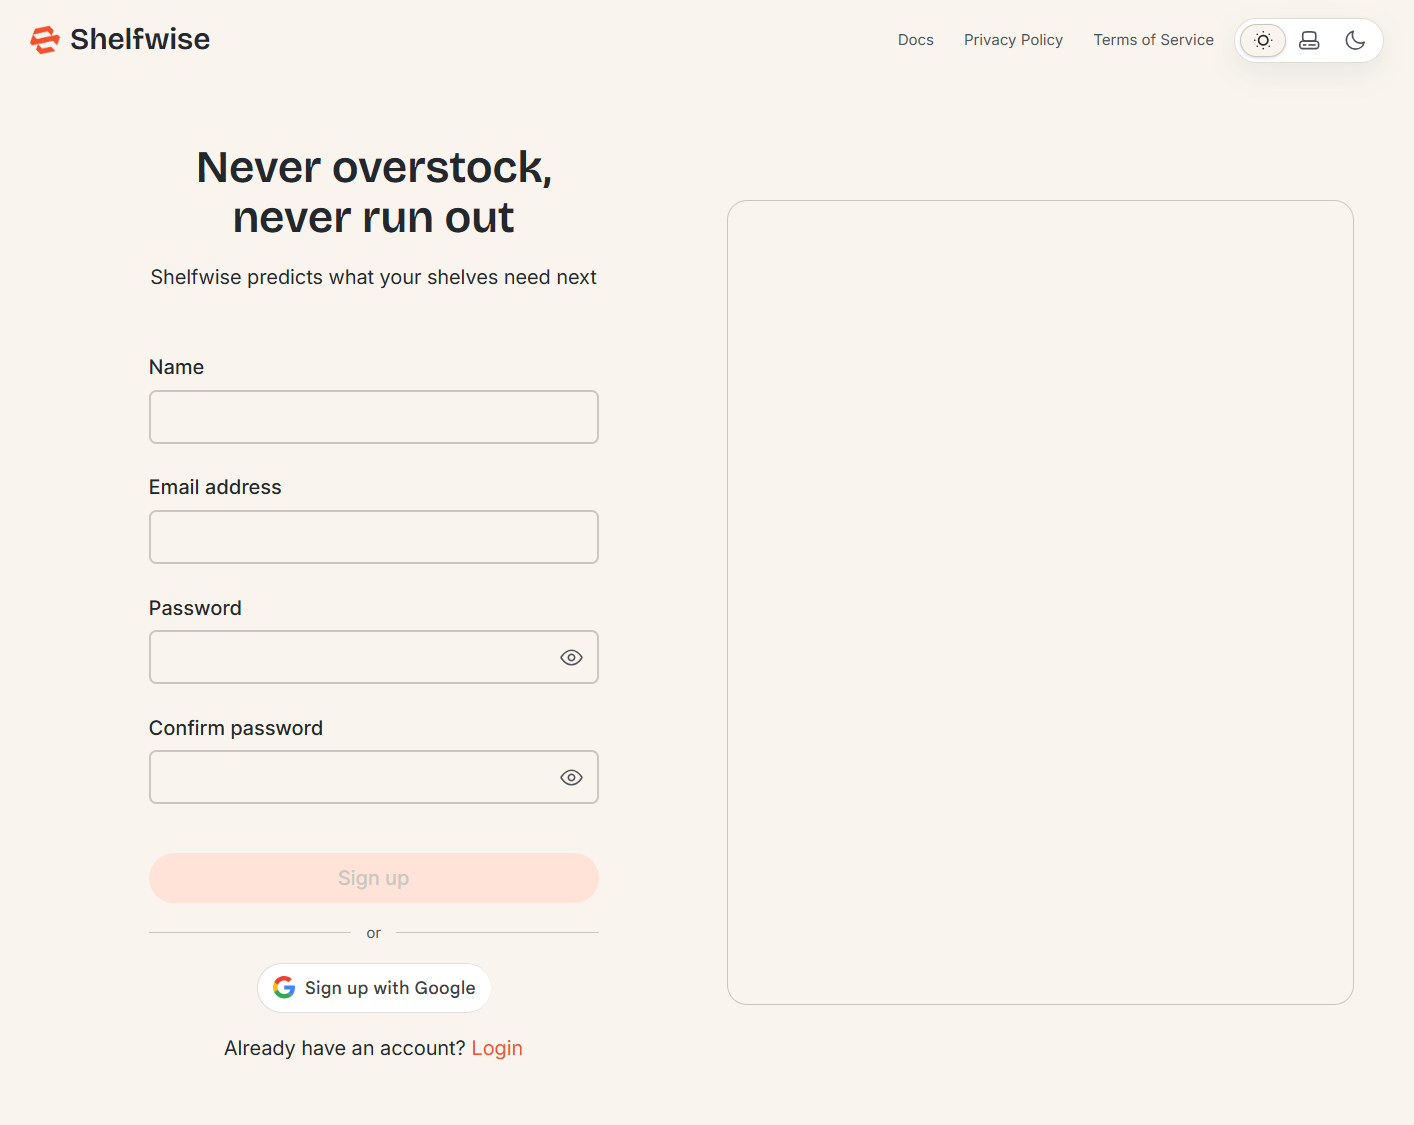
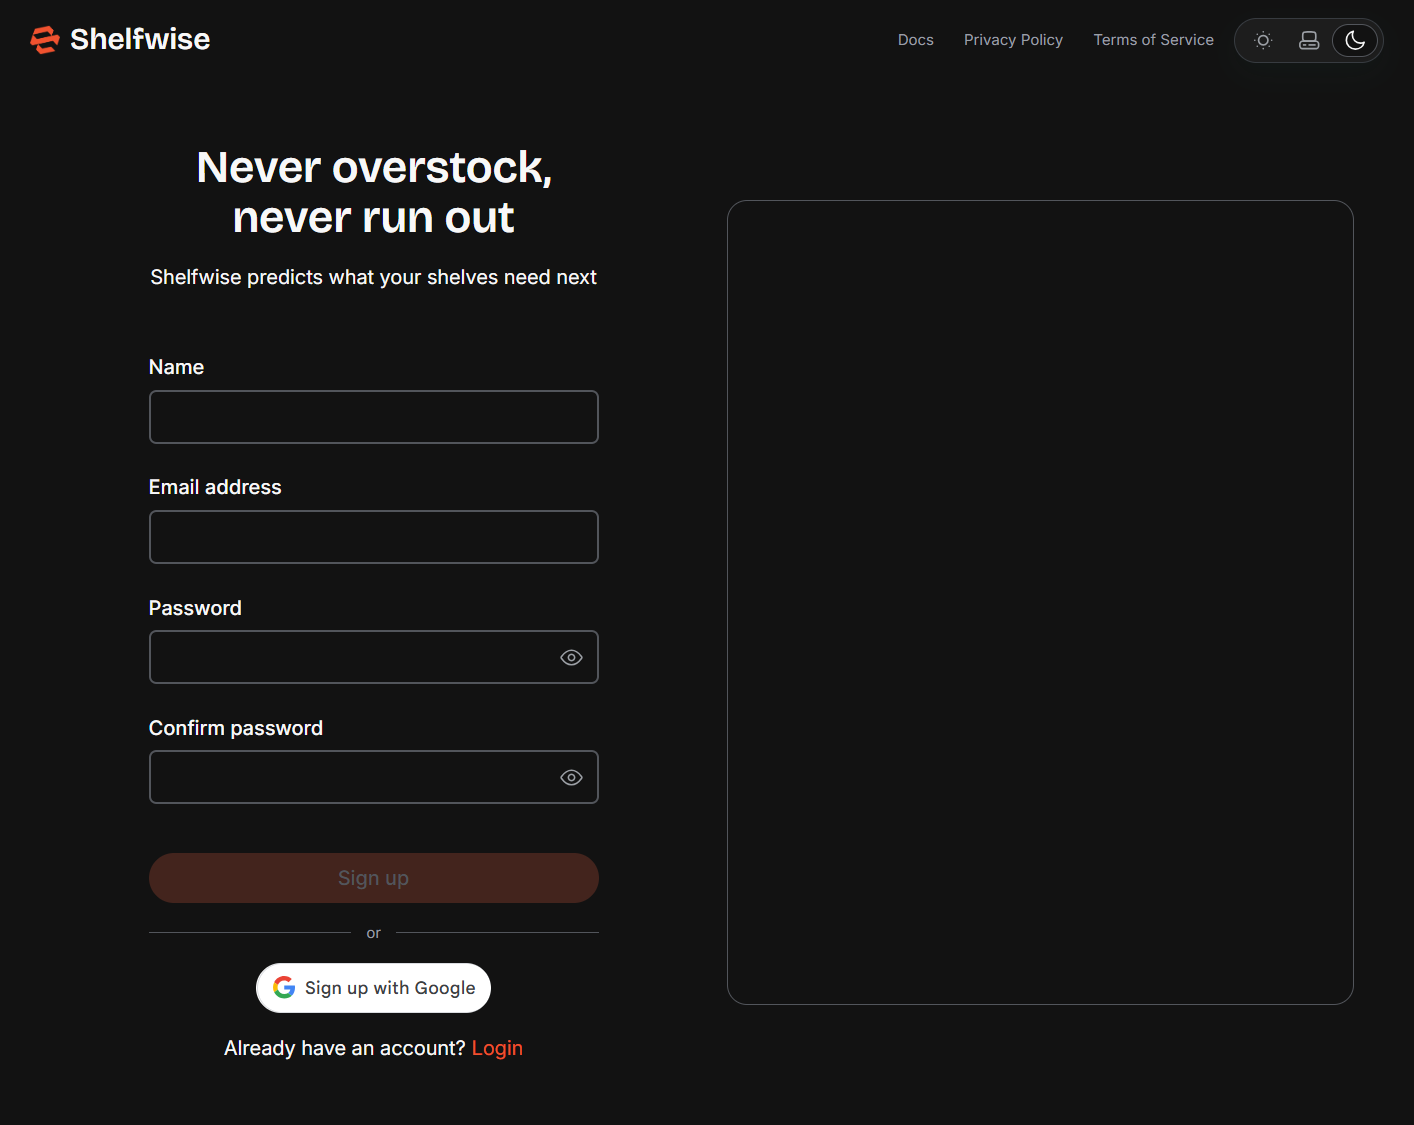
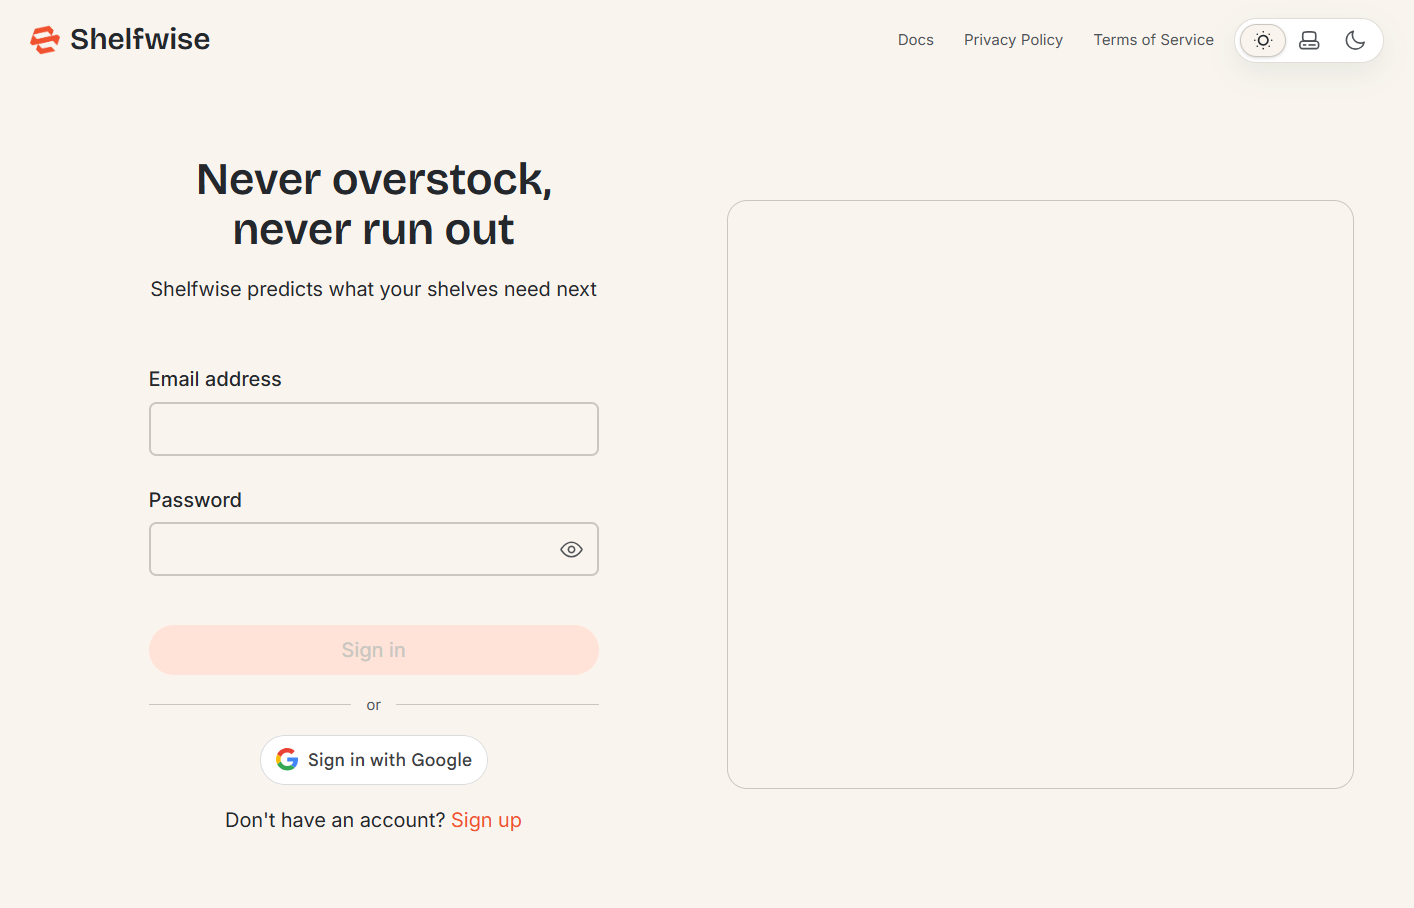
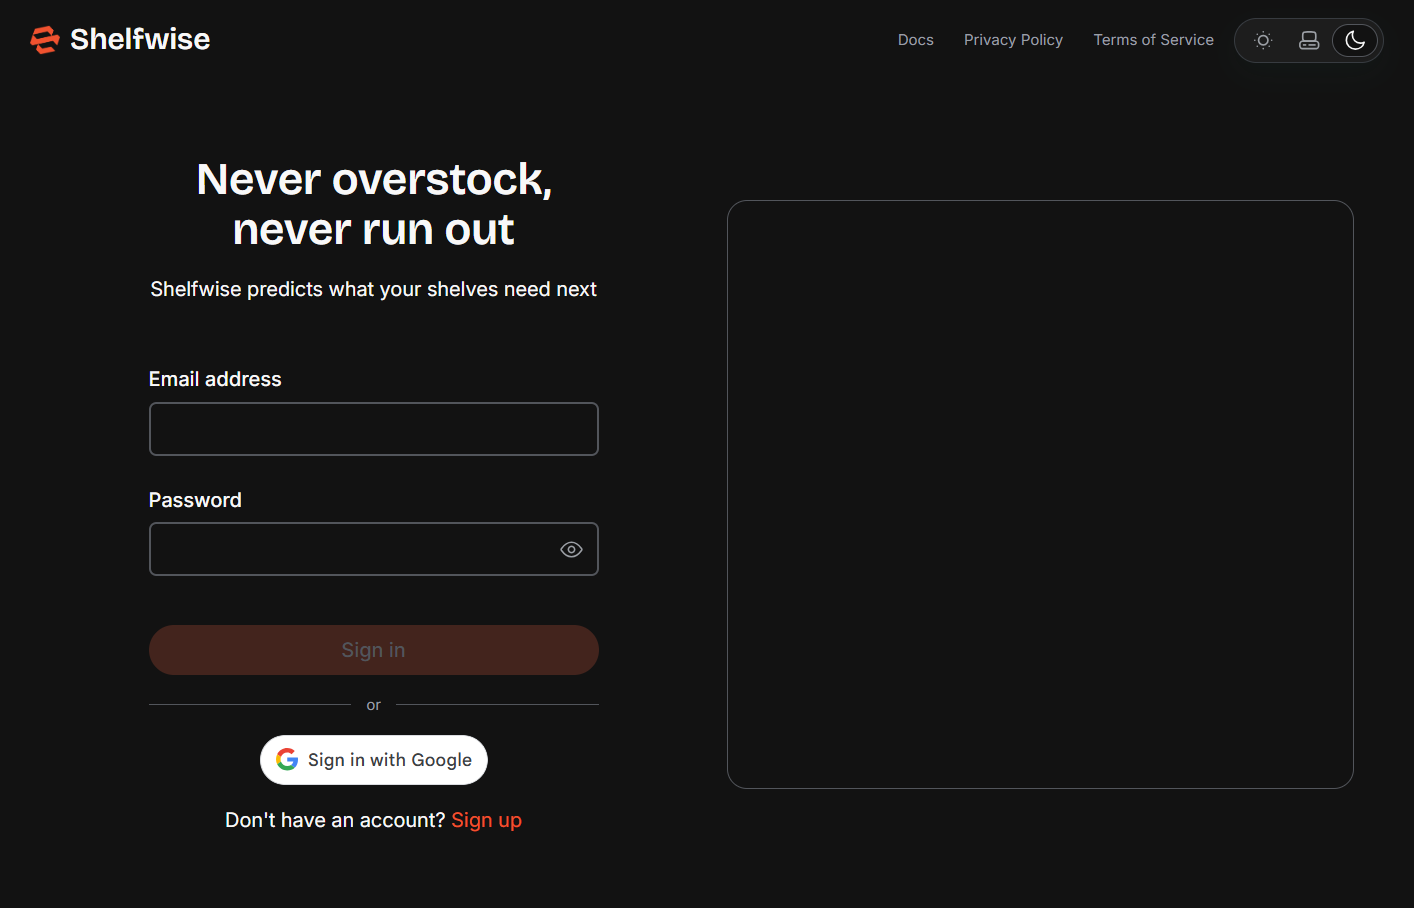
Create a free account by clicking Sign up and filling in your name, email address, and a password. You can also sign up instantly using your Google account via the Continue with Google button. Once registered, log in with your credentials to access your personal dashboard. Your data and forecasts are private to your account.
Dashboard
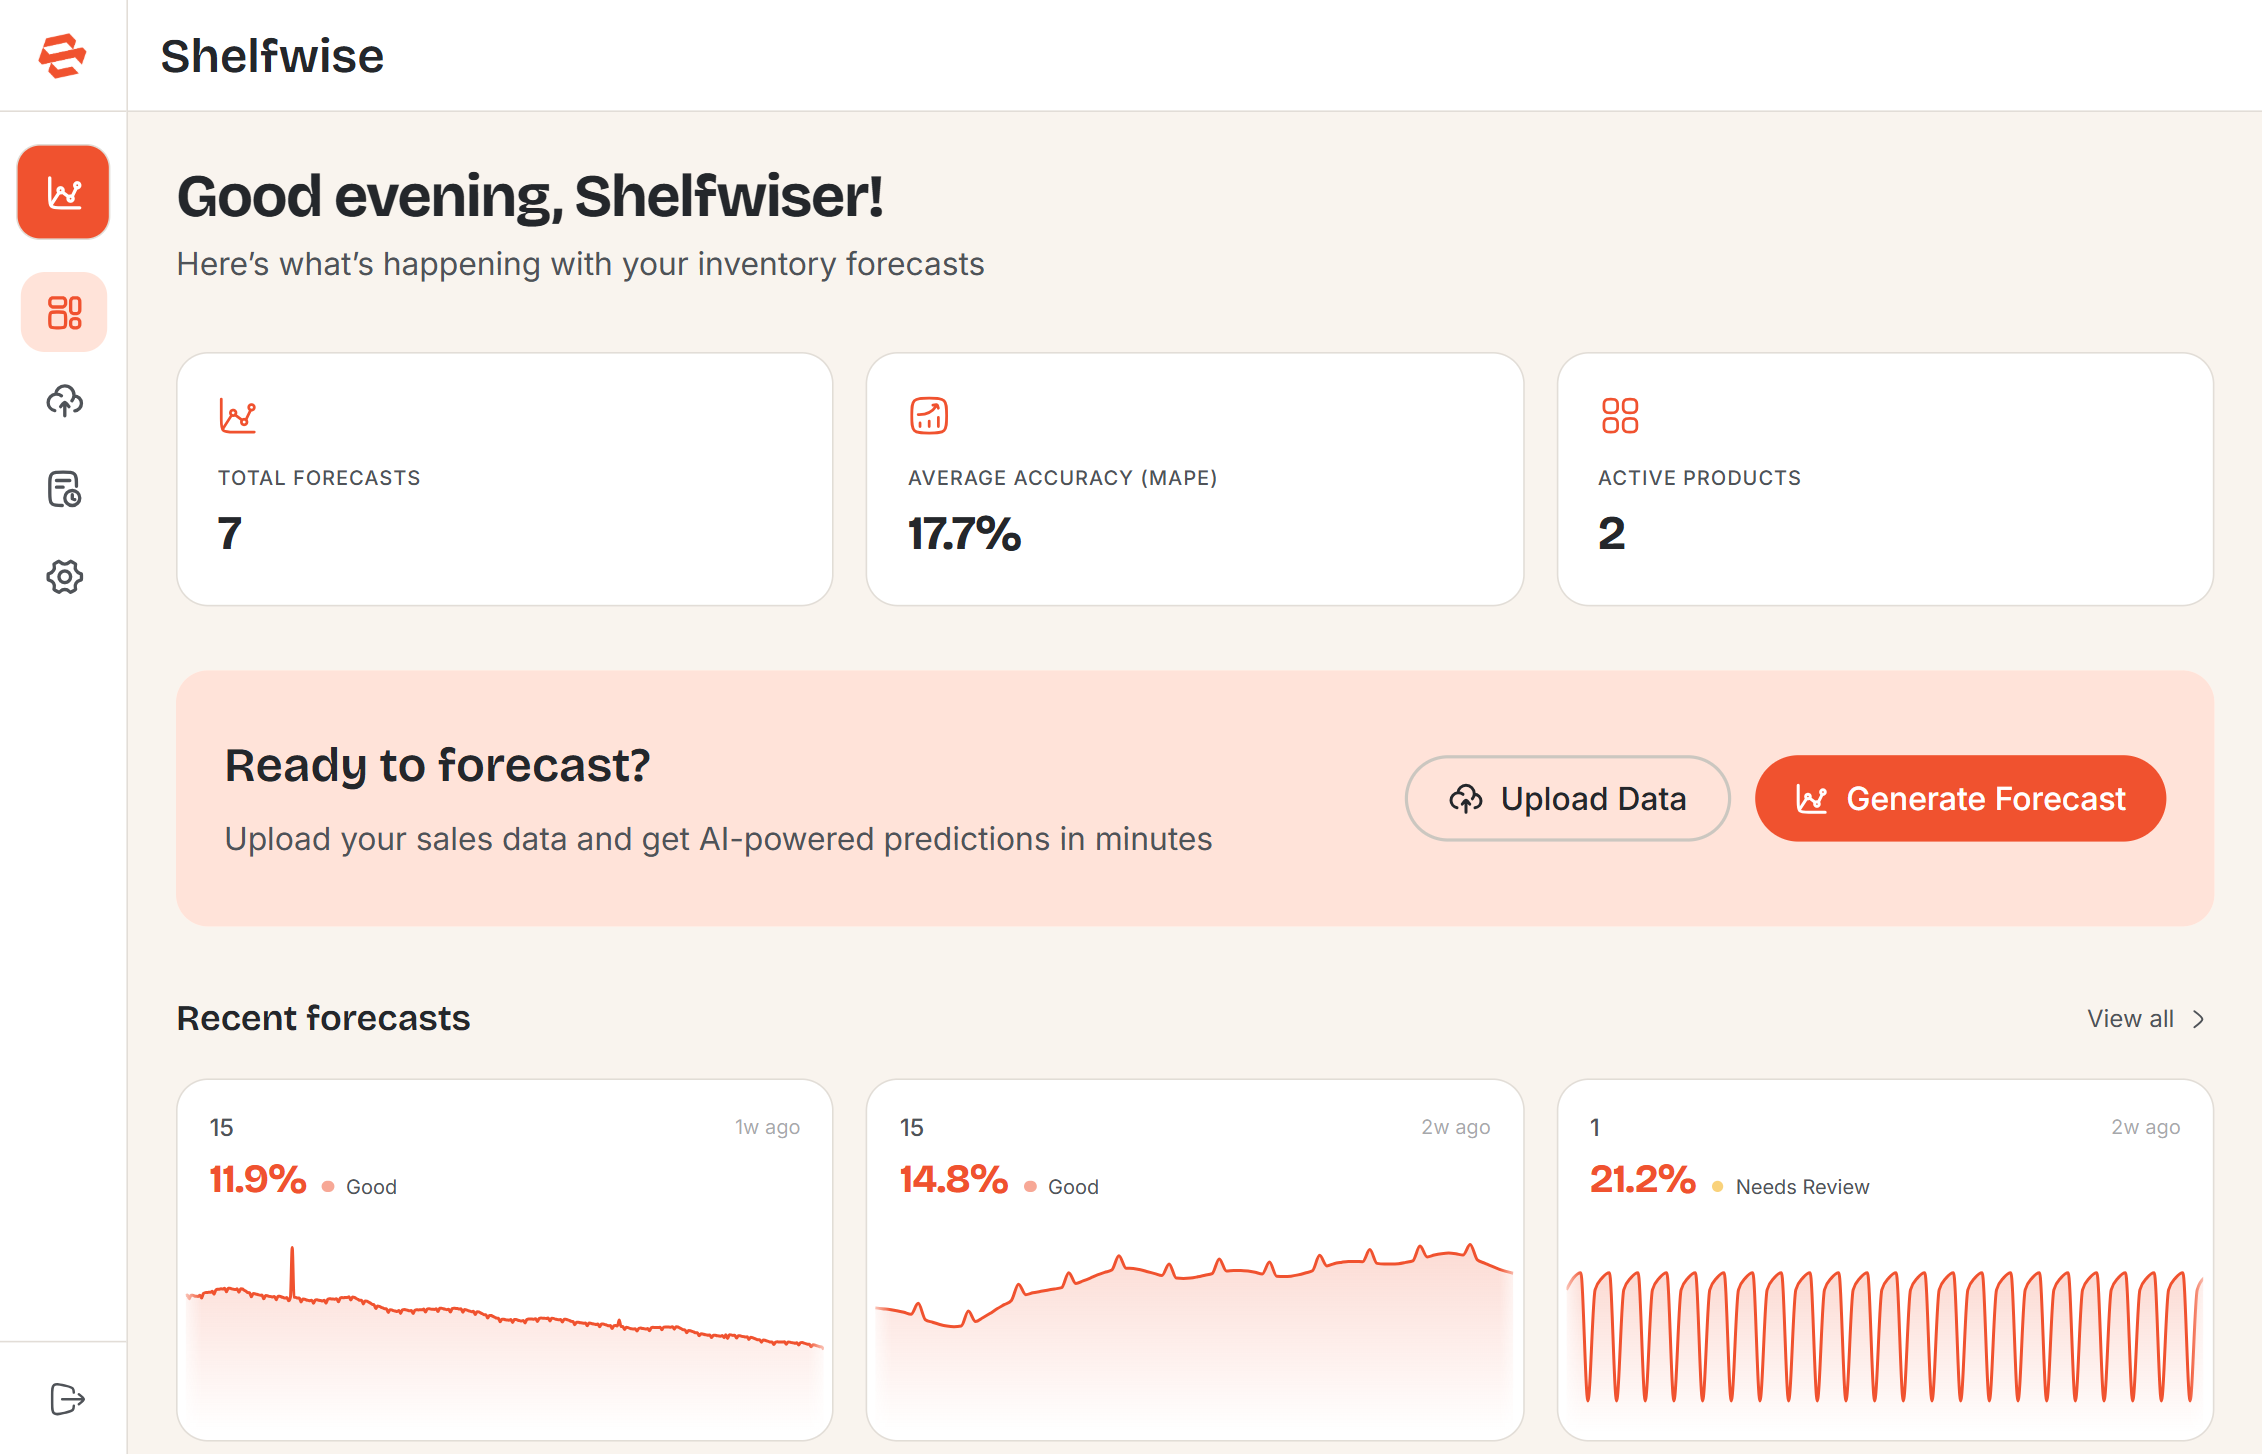
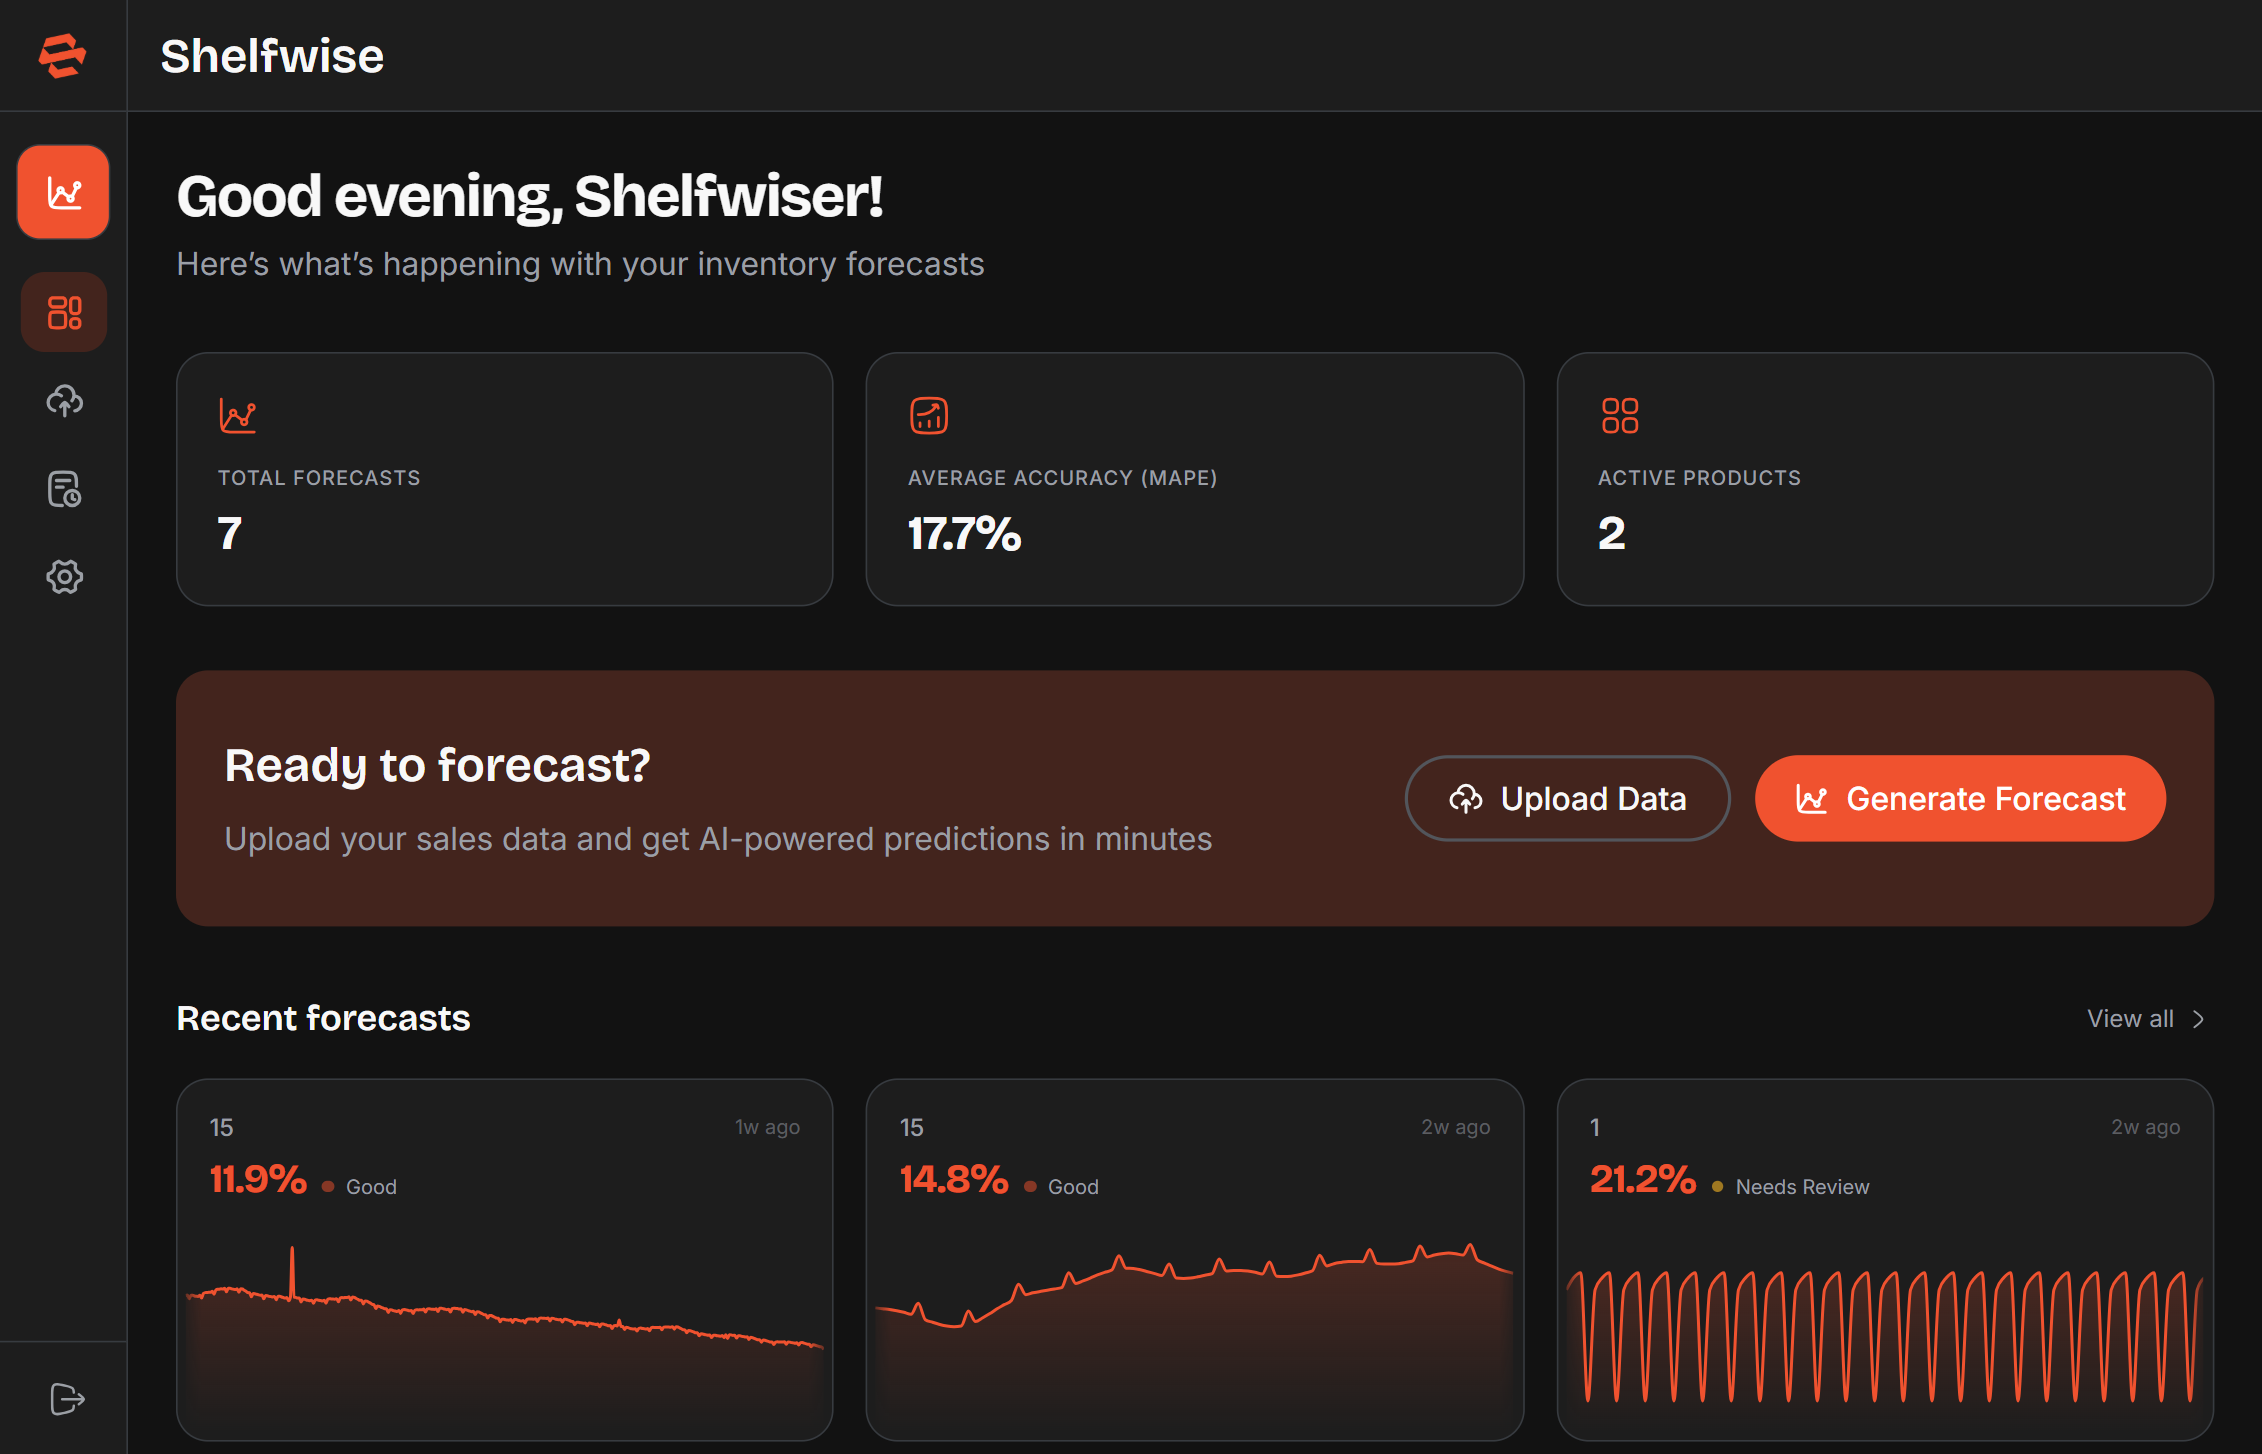
After logging in, you land on the Dashboard — your command centre for everything in Shelfwise. At a glance you can see three key statistics at the top of the page:
- Total Forecasts — the total number of forecasts you have generated.
- Average Accuracy — your mean forecast accuracy across all completed forecasts.
- Active Products — the number of products currently available for forecasting.
Below the stats, the Recent Forecasts grid shows your latest forecasts as cards, each with a sparkline chart and accuracy indicator. Click any card to open the full forecast result. If you haven't generated any forecasts yet, the dashboard shows a prompt to upload data and get started.
Uploading Your Data
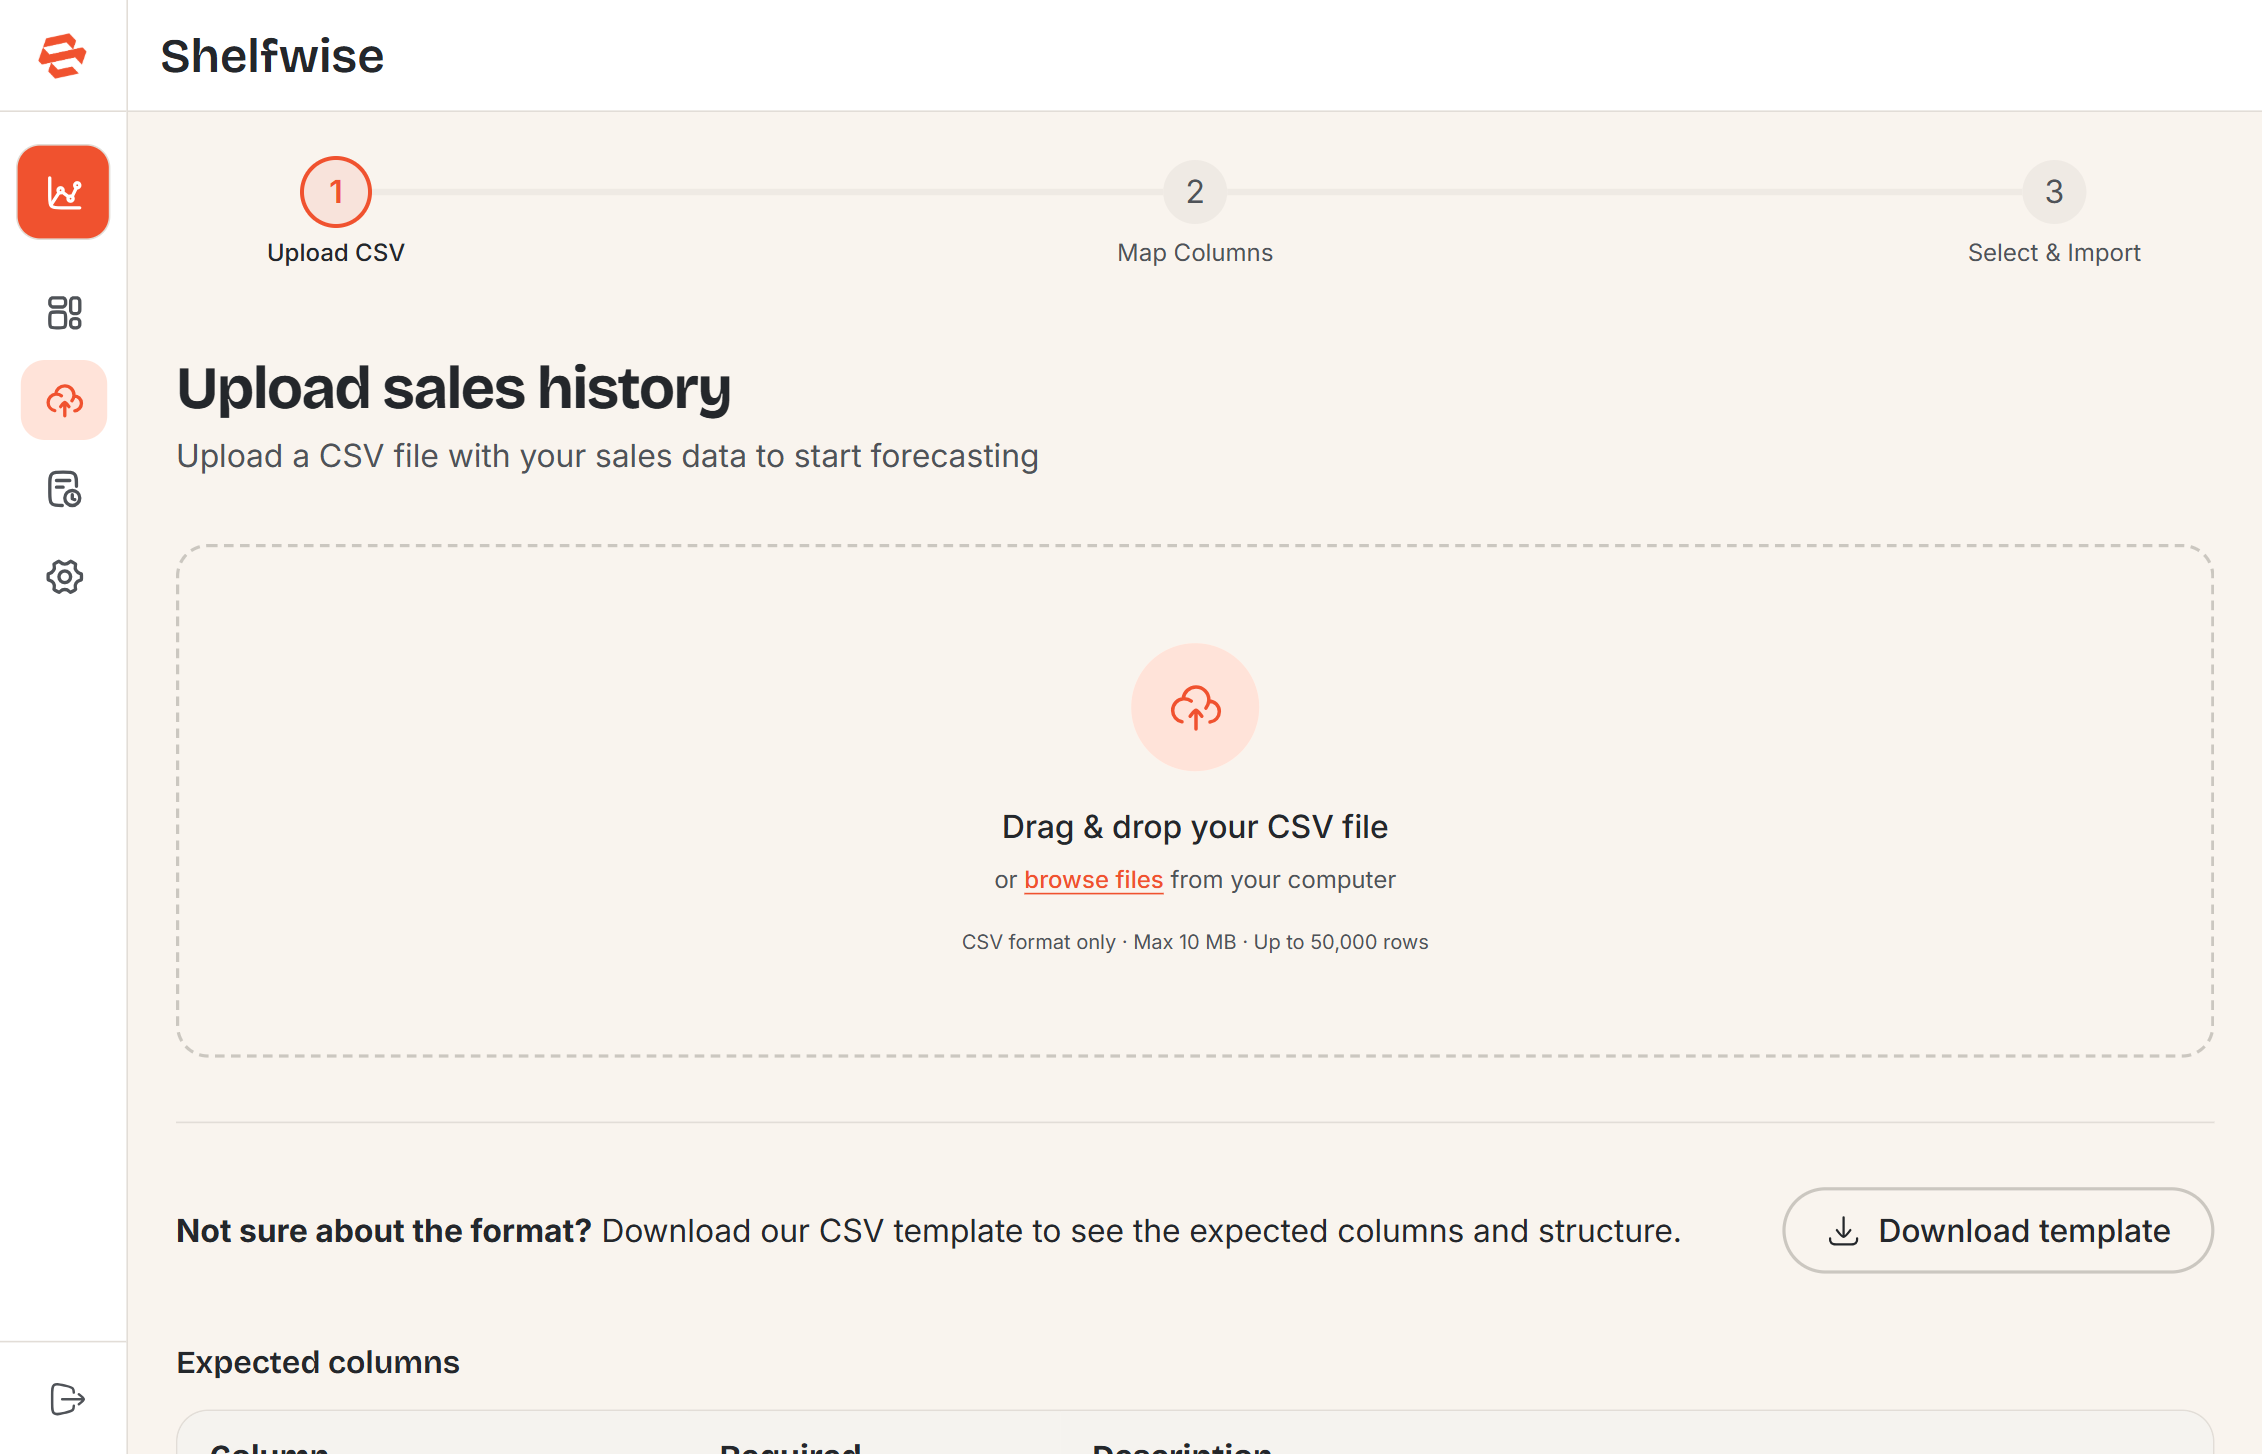
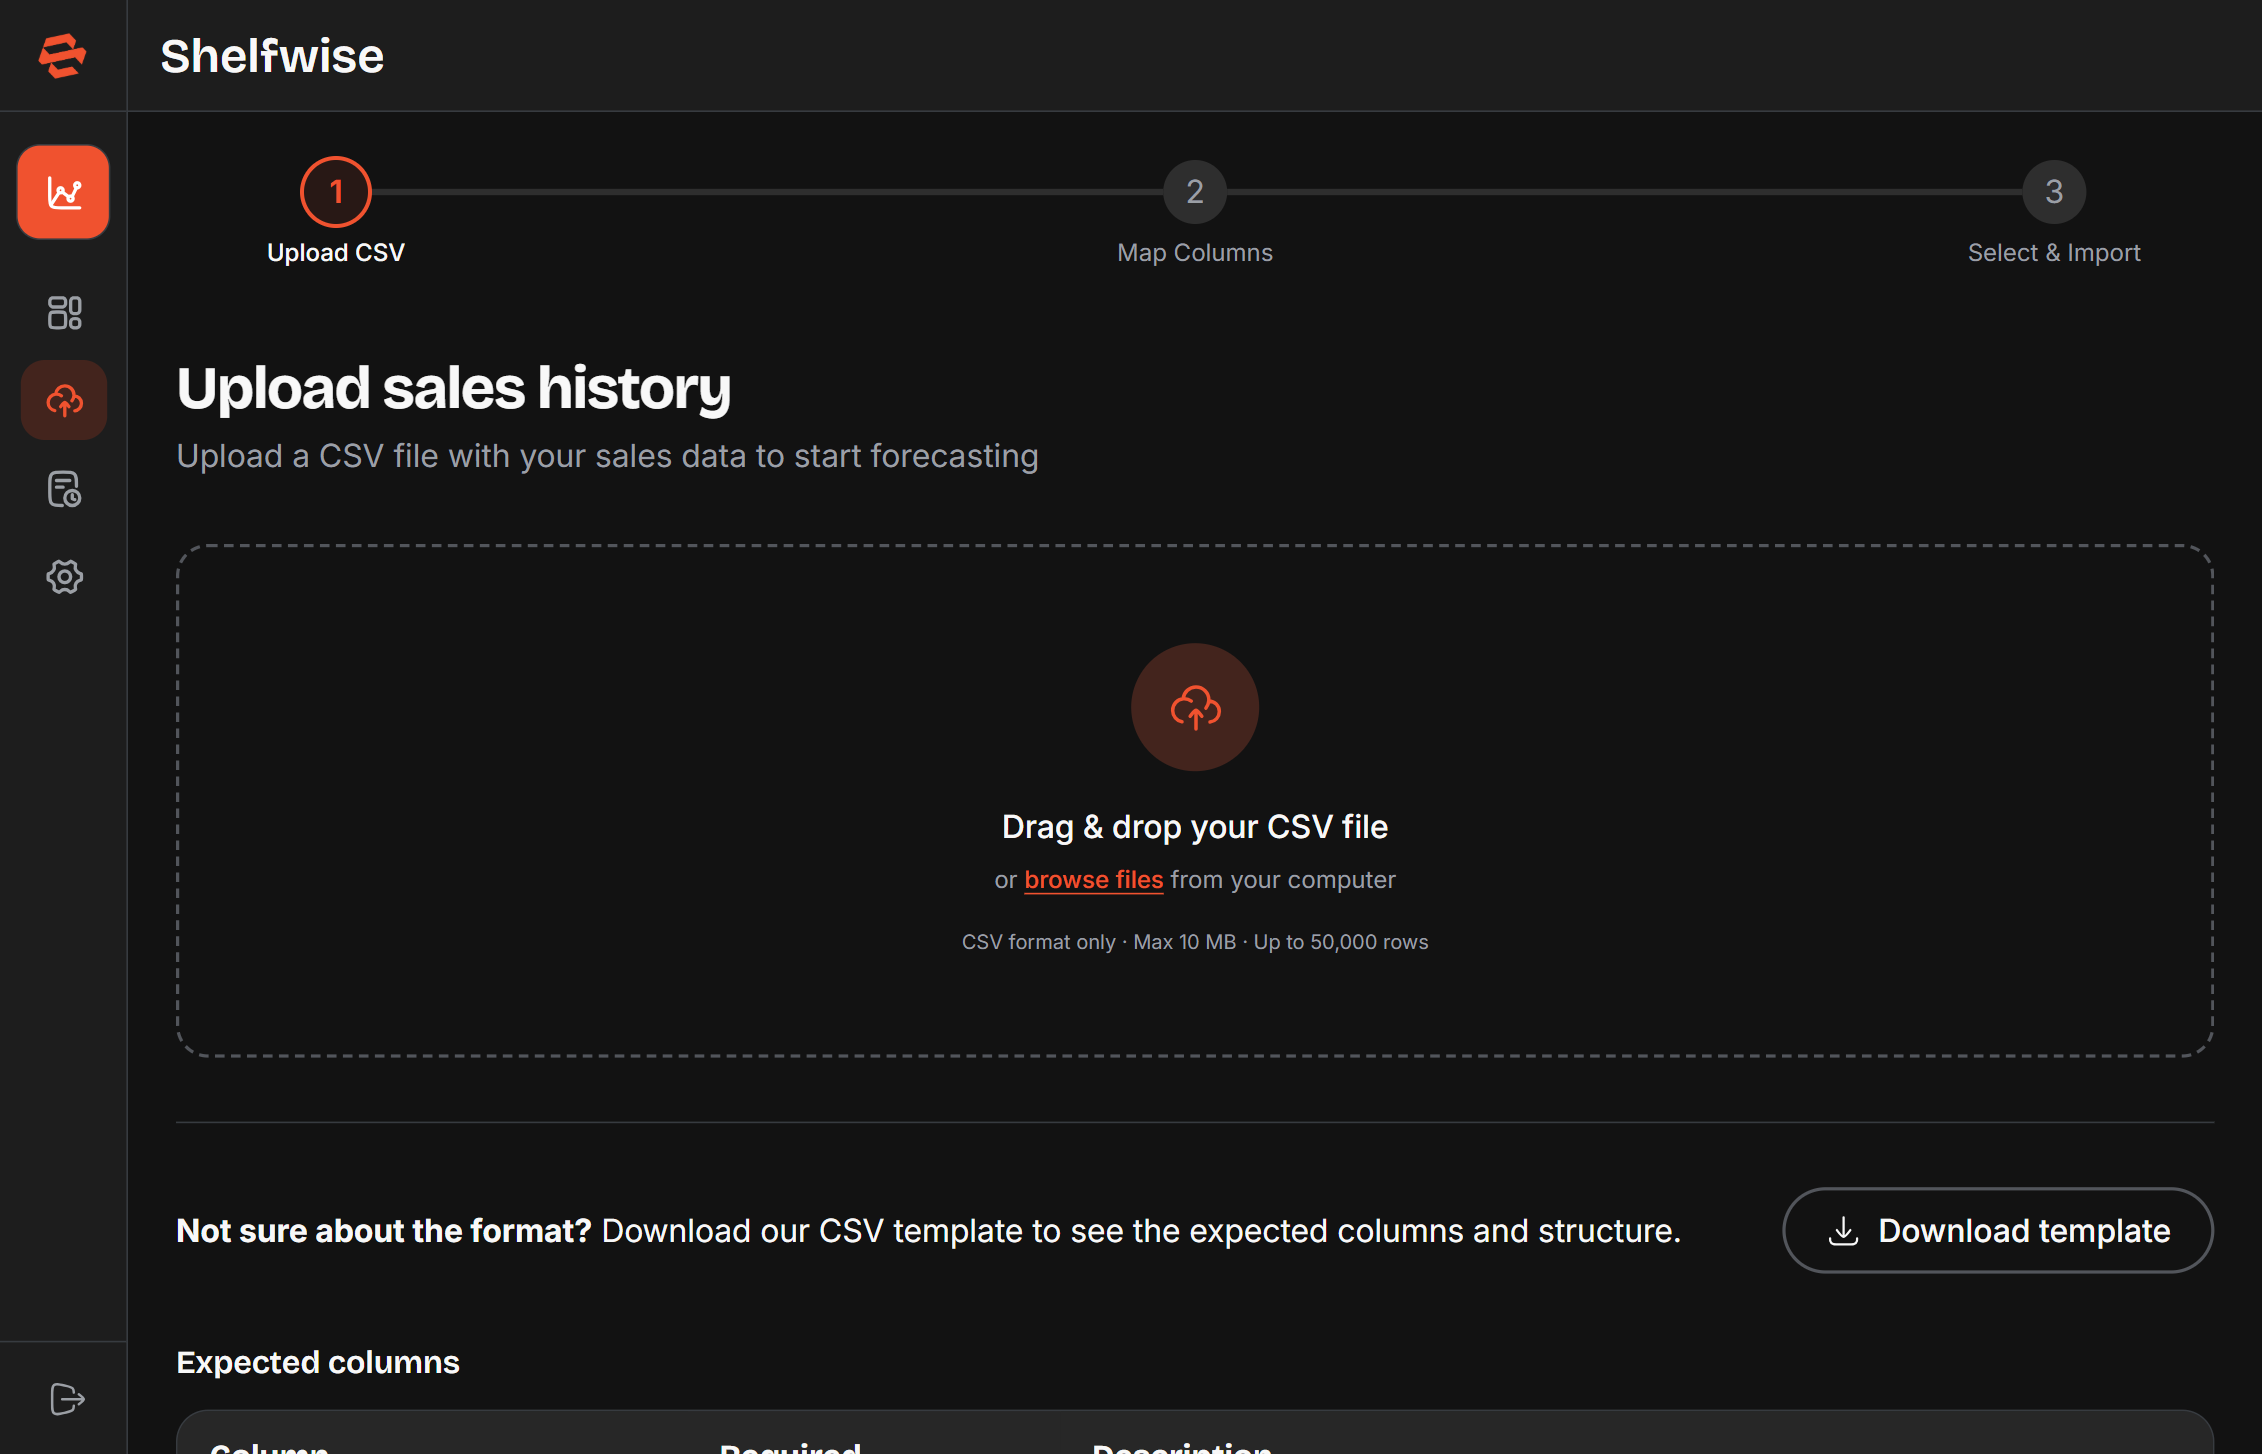
Navigate to Upload Data in the sidebar to import your historical sales records. Shelfwise accepts CSV files up to 10 MB. The upload wizard walks you through three steps.
Step 1 — Select your file
Drag and drop your CSV onto the upload zone, or click to browse your files. Your CSV must contain at minimum a date column, a product identifier column, and a quantity sold column. Not sure of the format? Download the CSV template from the upload page to see an example with the expected column structure.
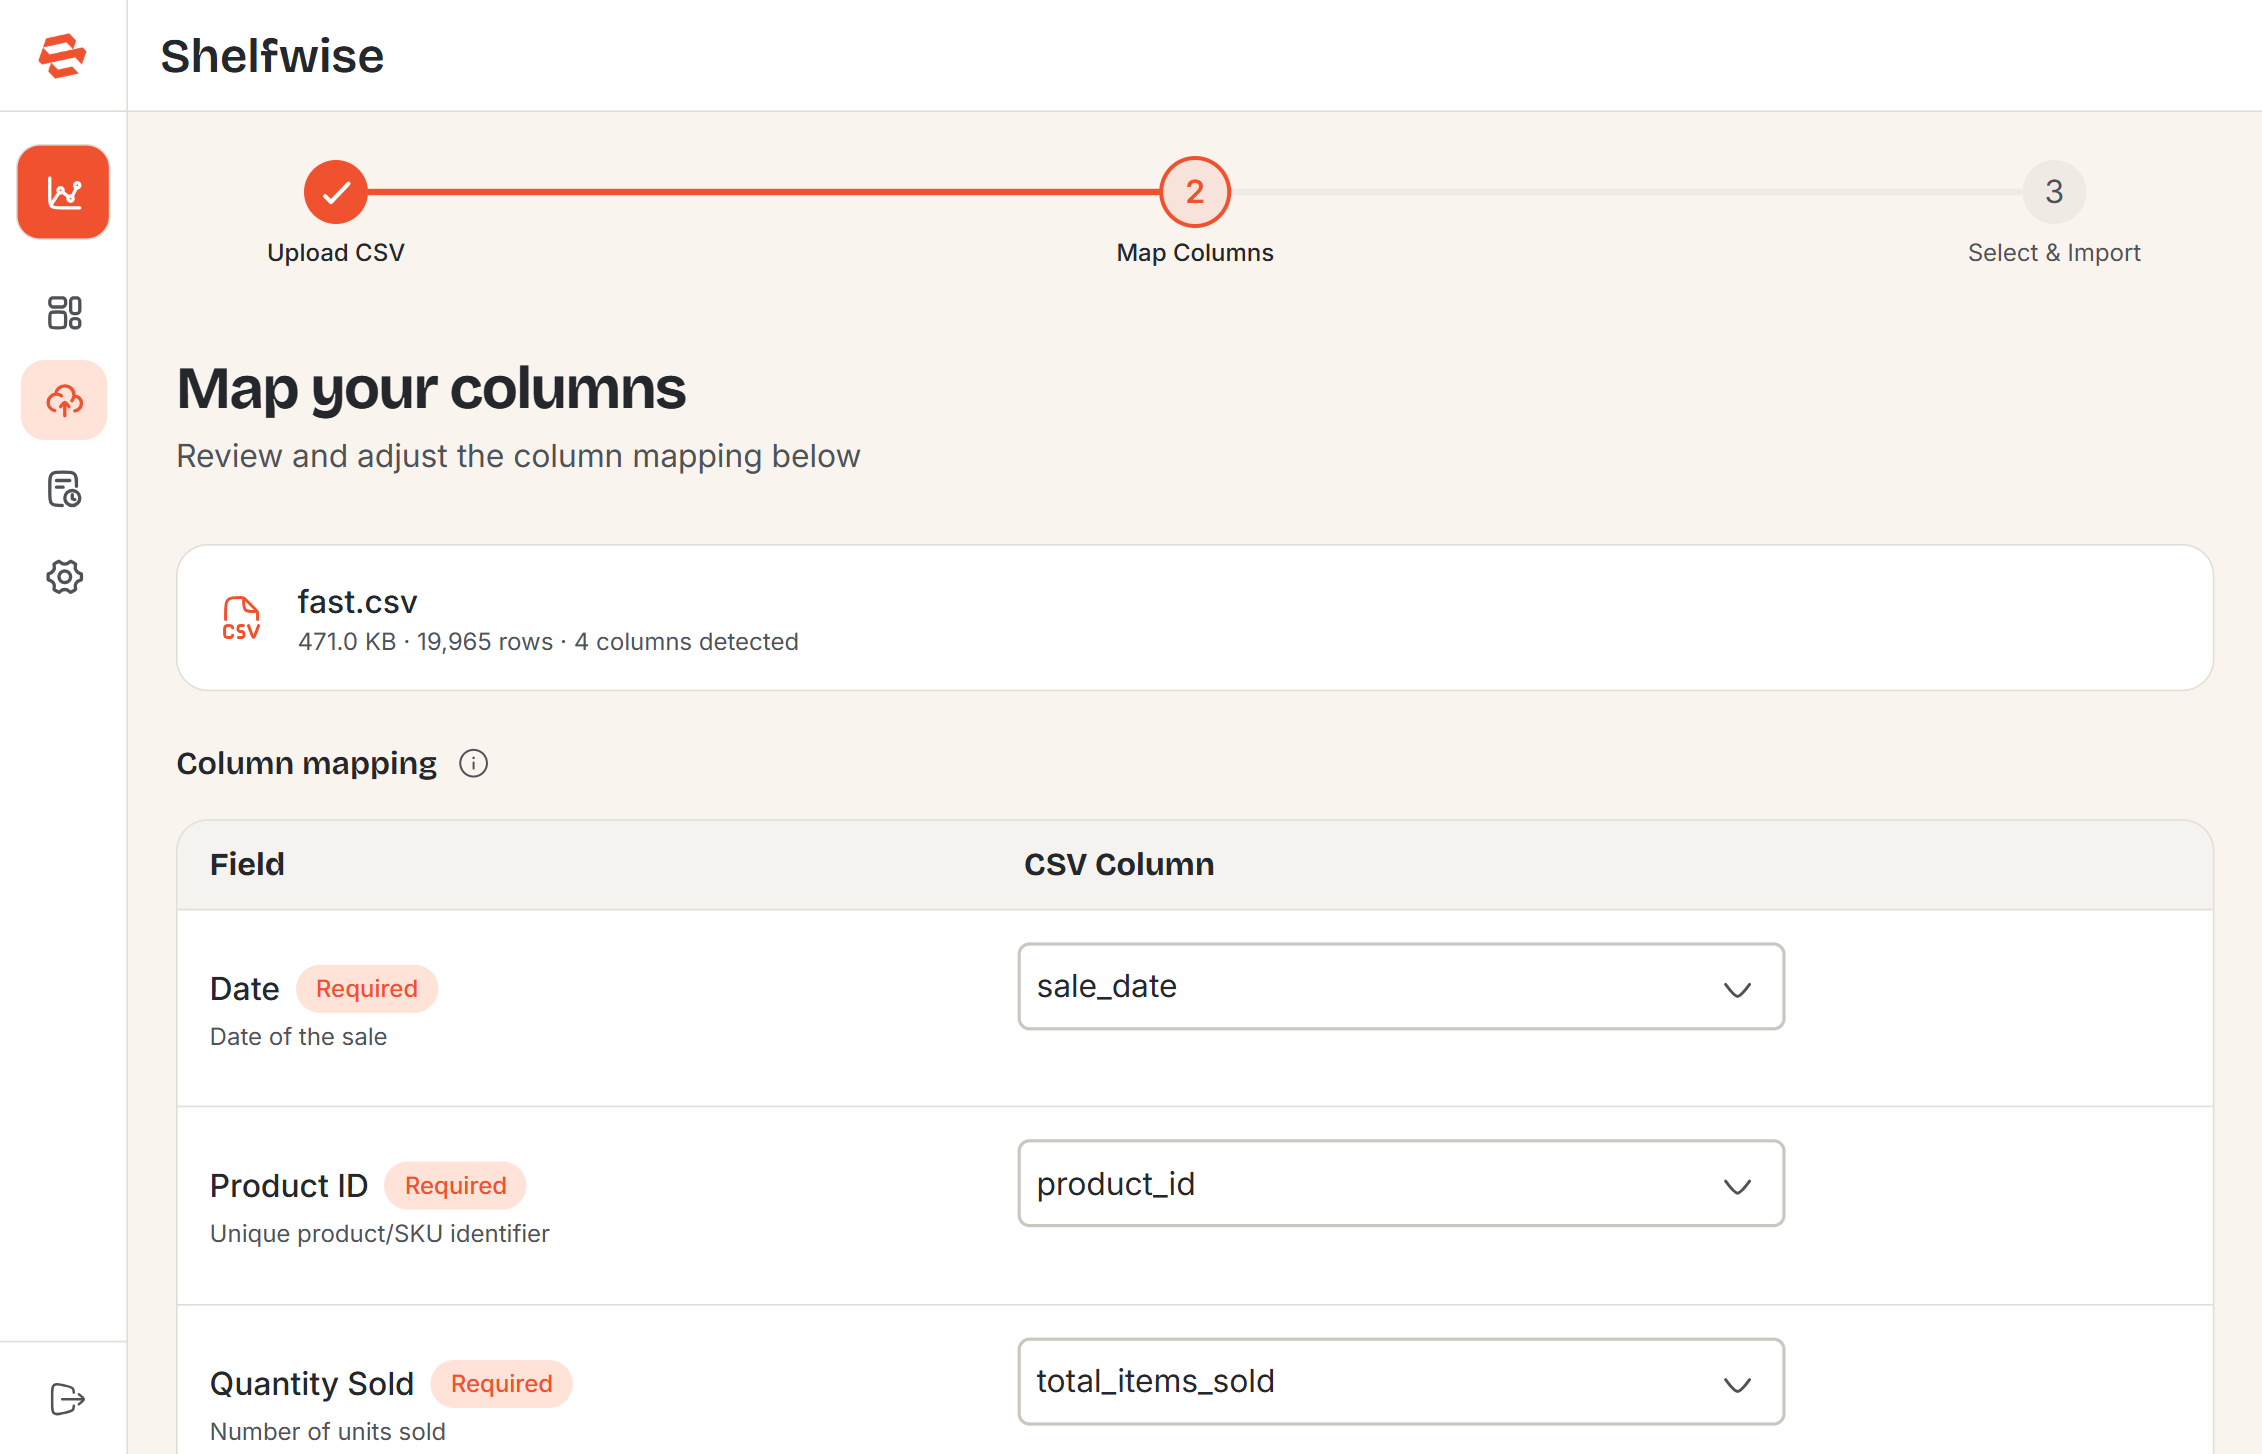
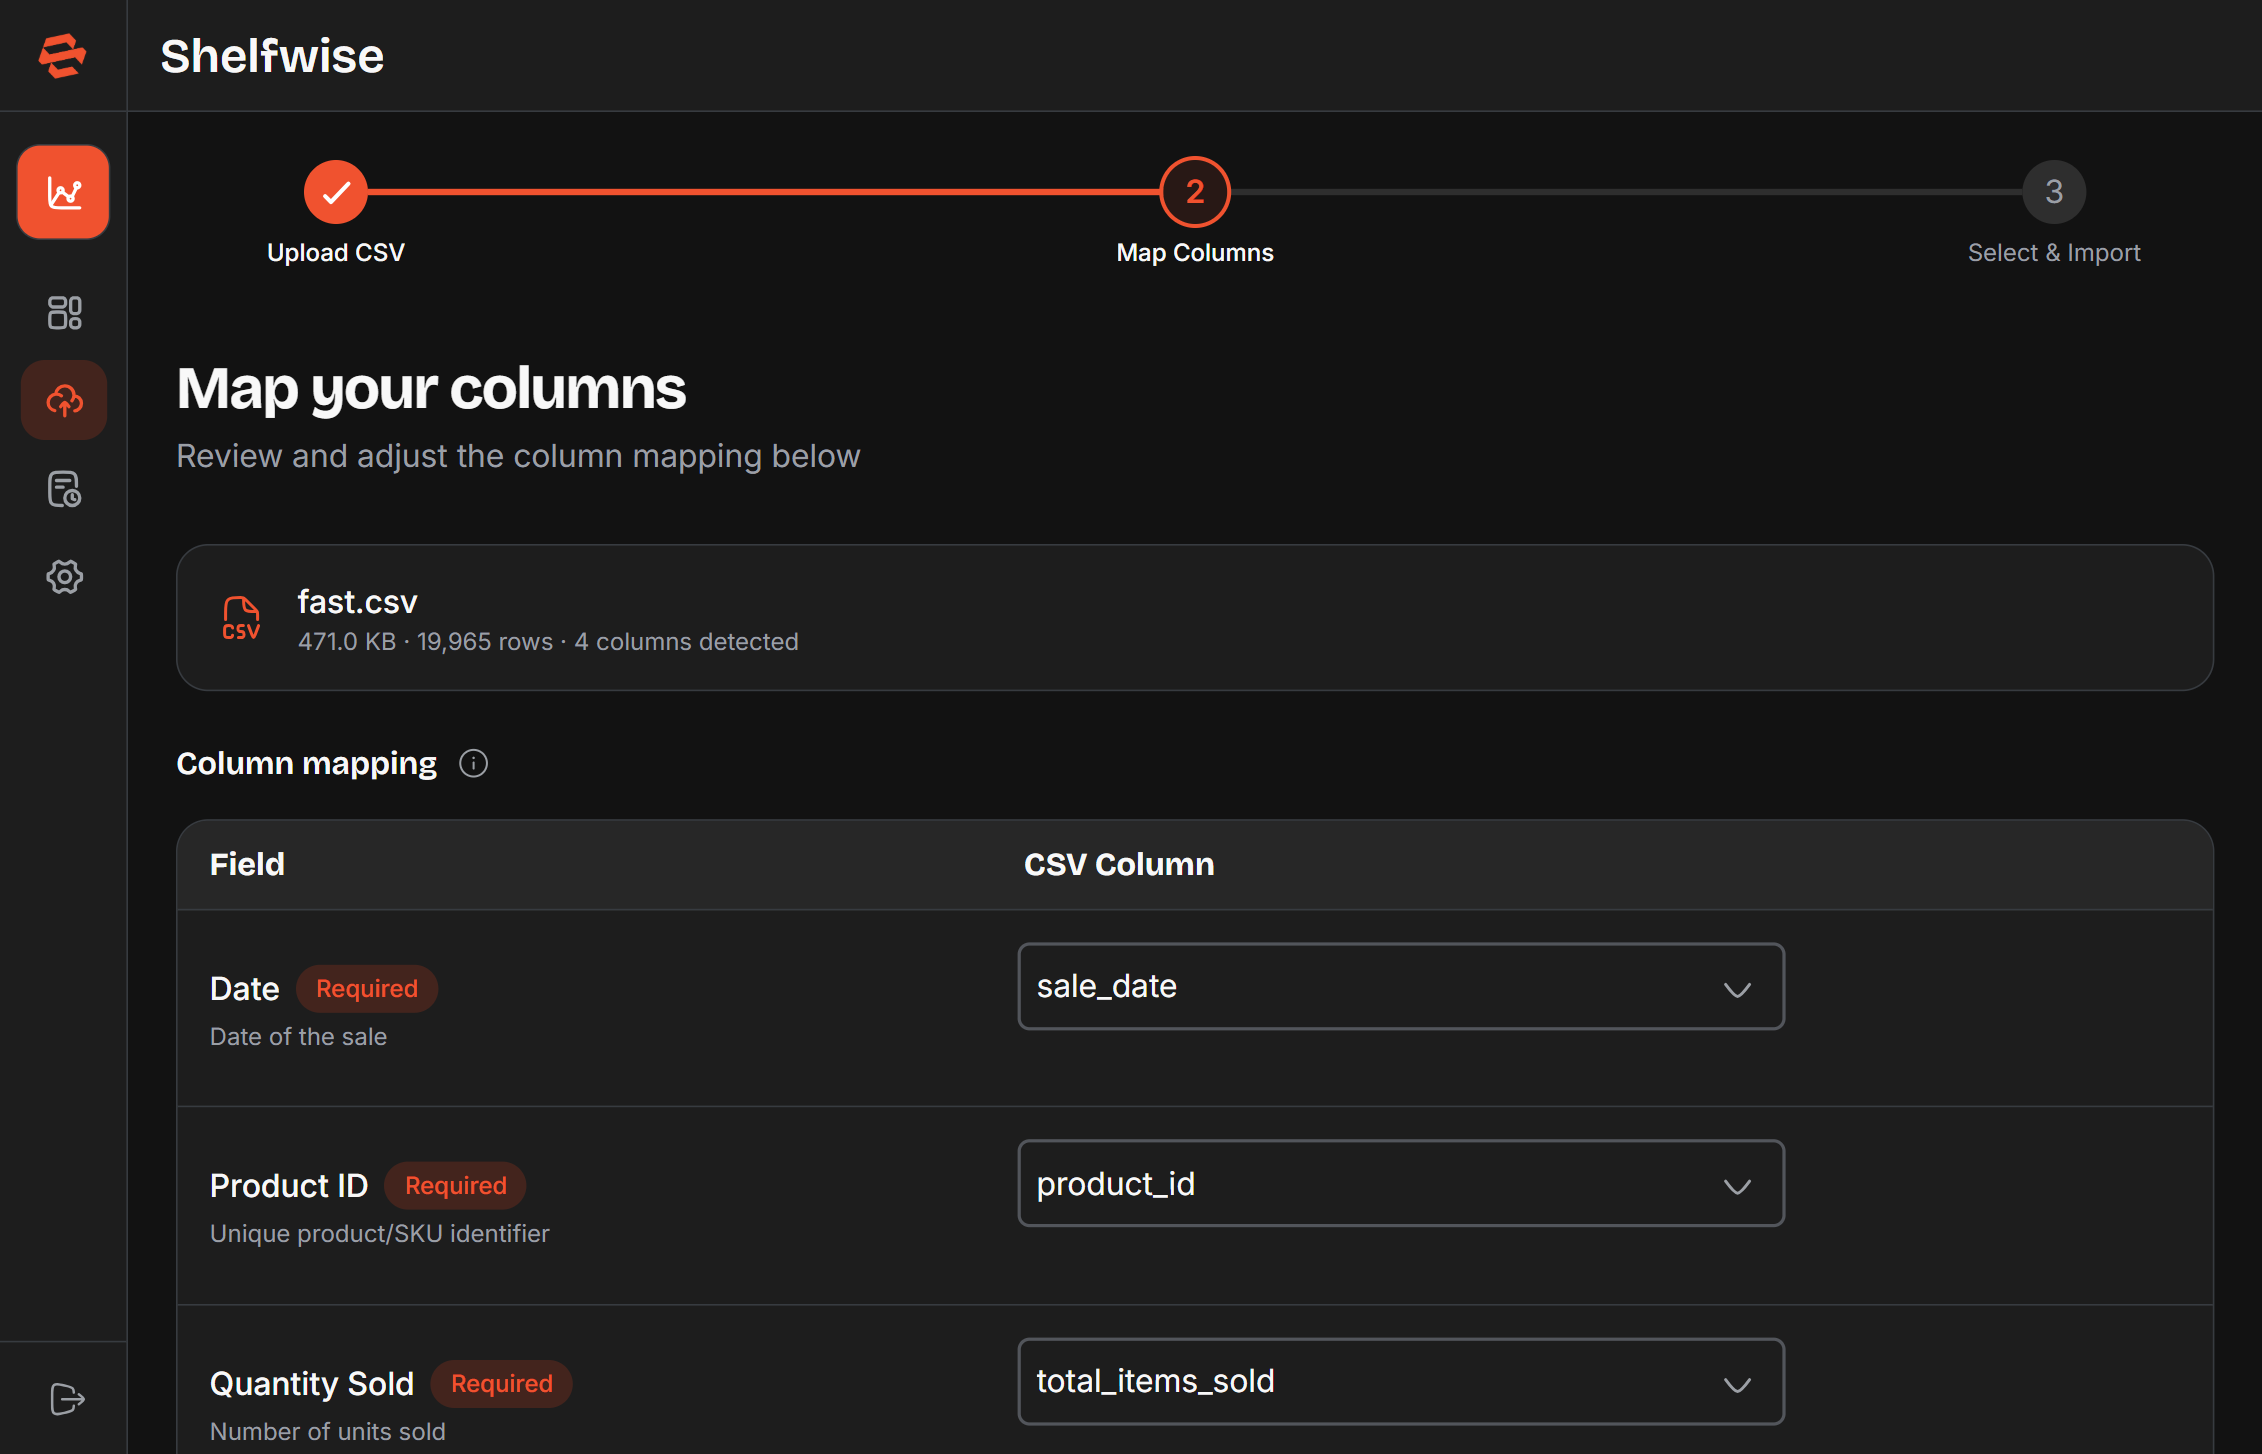
Step 2 — Map your columns
Shelfwise automatically suggests how your CSV columns map to the required fields — date, product ID, quantity sold, and the optional product name. Each suggestion shows a confidence level. Review the mappings and adjust any that are incorrect before continuing.
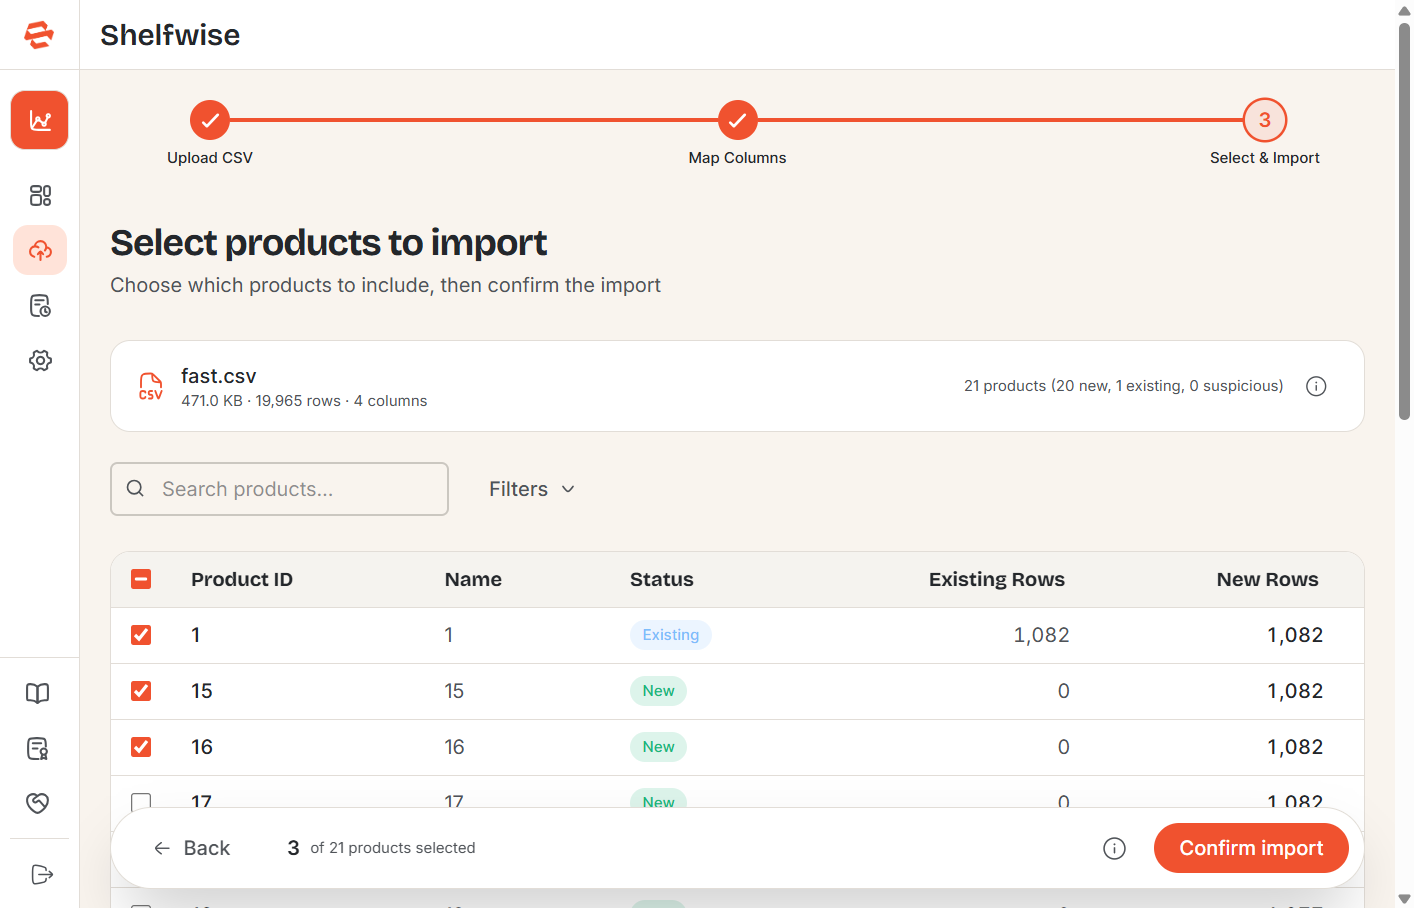
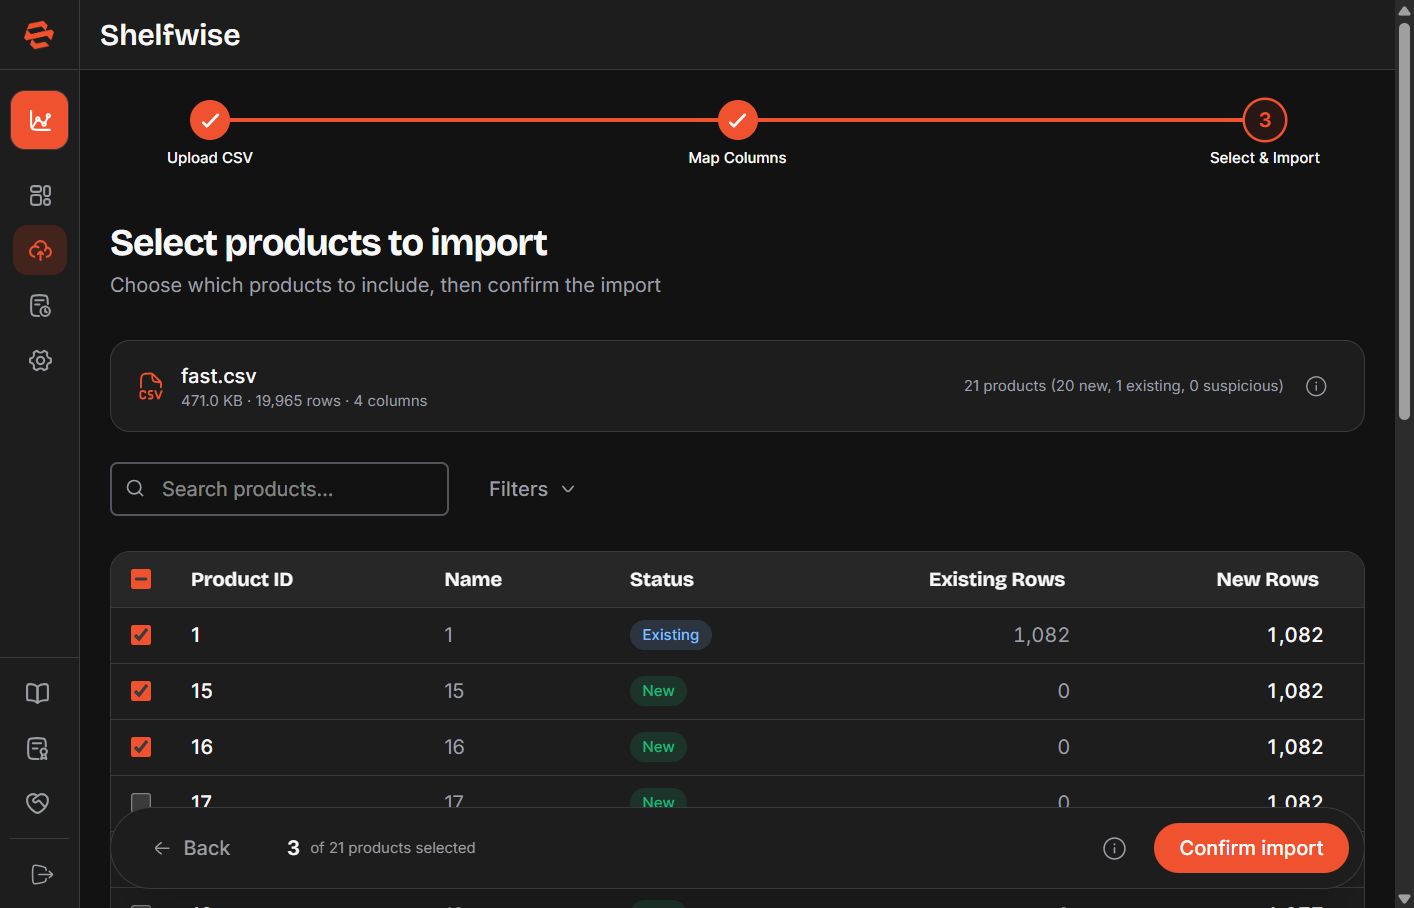
Step 3 — Review and confirm
Before the data is imported, Shelfwise validates your file and shows a summary for each product: row count, date range, and any warnings such as missing values or suspicious entries. Review the results, then click Confirm Import to finalise. Your products will immediately become available for forecasting.
Generating a Forecast
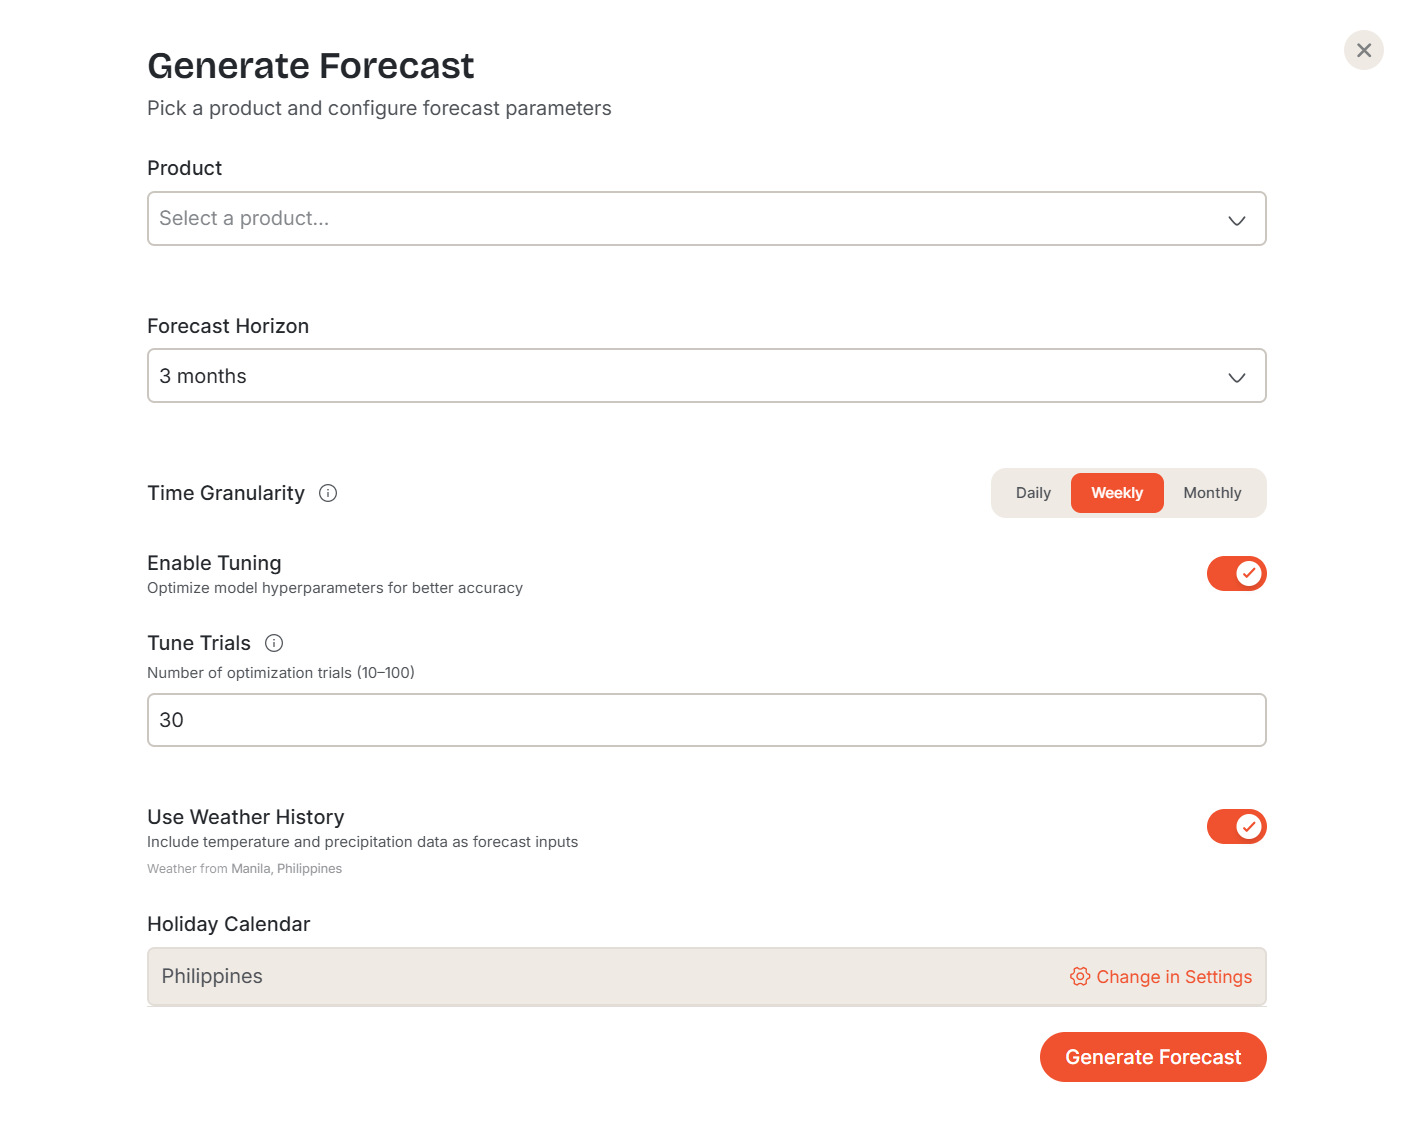
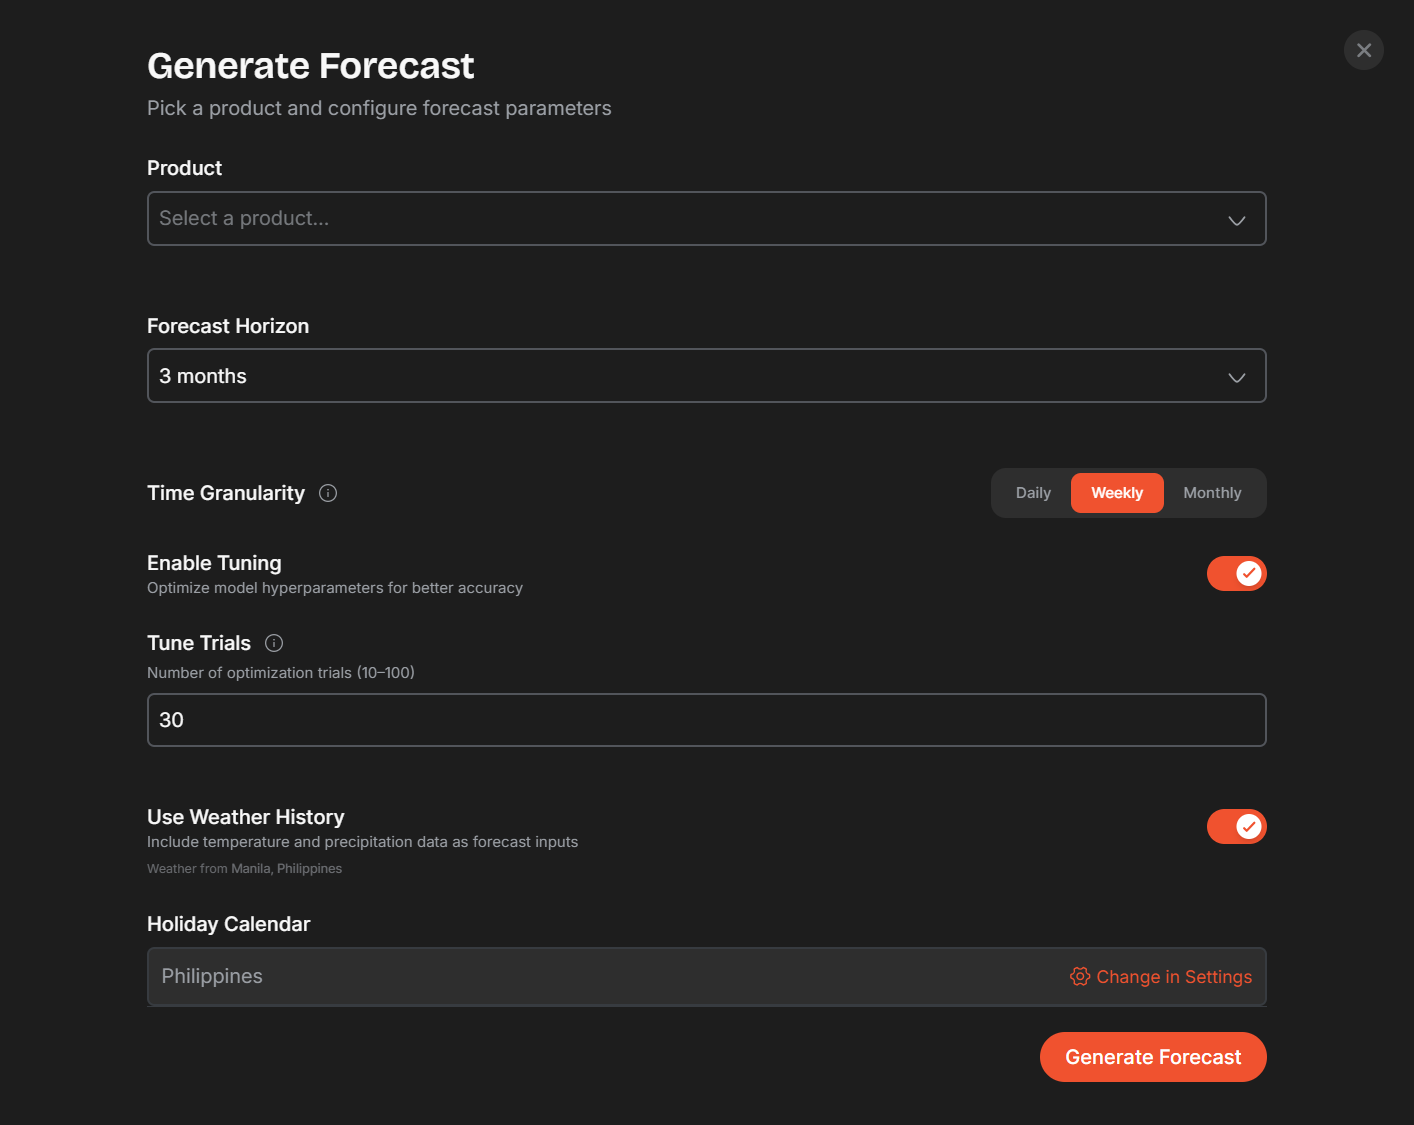
Click the Generate Forecast button — the highlighted button in the sidebar or page header — to open the forecast panel. Configure the following options, then click Generate.
Configuration options
- Product — select which product to forecast from your imported data.
- Forecast Horizon — how many days ahead to predict demand.
- Forecasting Model — the algorithm to use (see below).
- Demand Profile — the expected demand pattern for this product (e.g. steady, intermittent).
- Time Granularity — the time unit for the forecast output (daily, weekly, or monthly).
- Seasonality Mode — whether seasonal effects are additive or multiplicative.
Available models
- Naive Forecast — uses the most recent observed value as the prediction. Simple and fast; good for stable, flat demand.
- Seasonal Naive — repeats the value from the same period in the previous cycle. Best for products with clear recurring seasonality.
- Croston SBA — designed for intermittent or slow-moving demand with many zero-sales periods.
- Prophet — a trend-and-seasonality model well-suited to products with holiday effects and long historical data.
- XGBoost — a gradient-boosting model that can capture complex, non-linear demand patterns from feature-rich data.
Once submitted, Shelfwise processes your historical data and generates the forecast. A status indicator tracks progress through each stage. Most forecasts complete within seconds.
Reading Your Forecast
Once a forecast completes, its detail page opens automatically. The page is divided into three main areas.
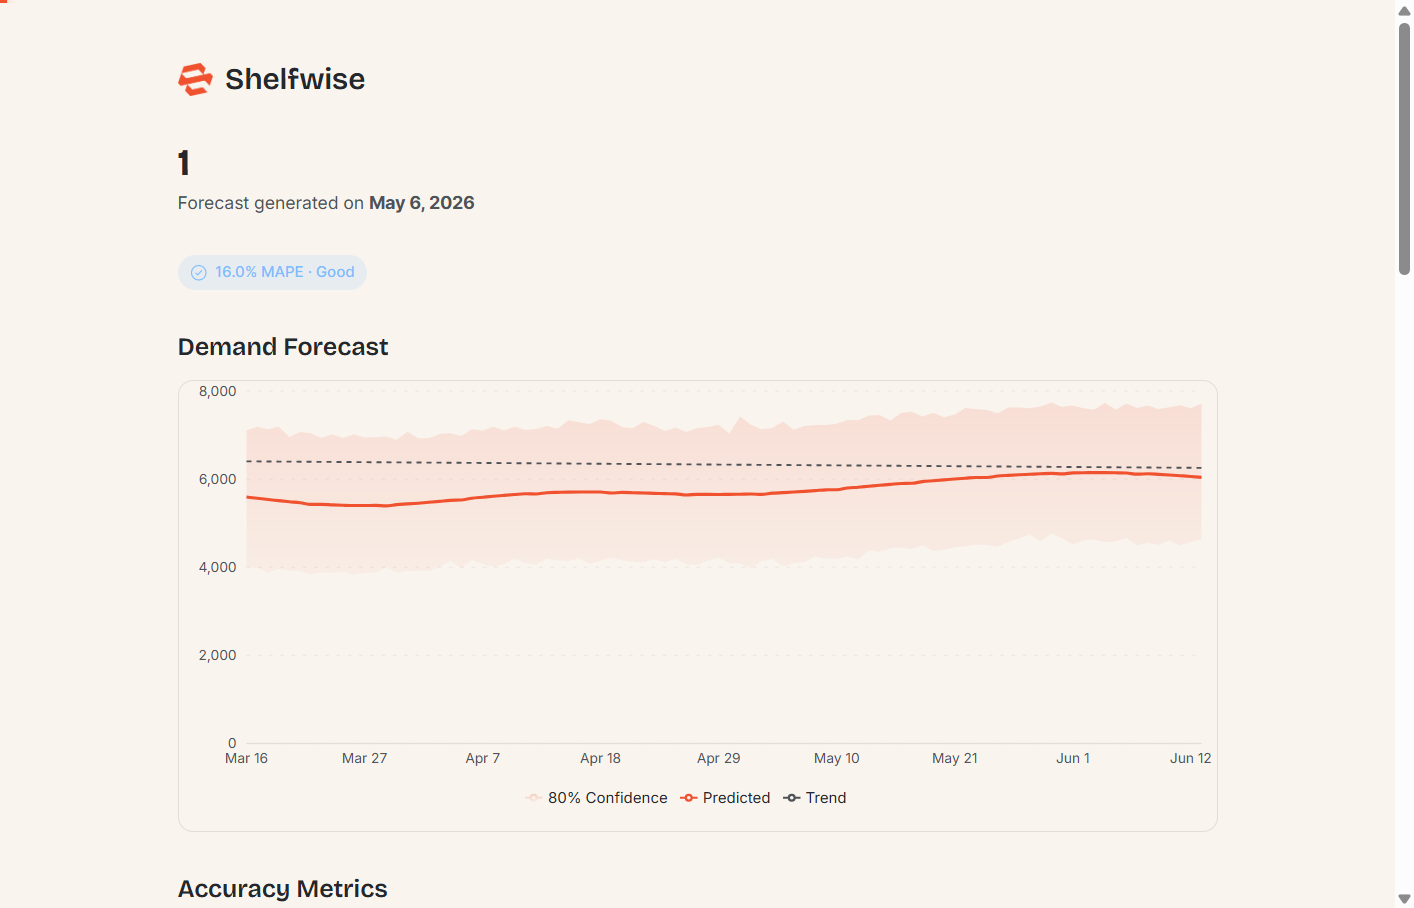
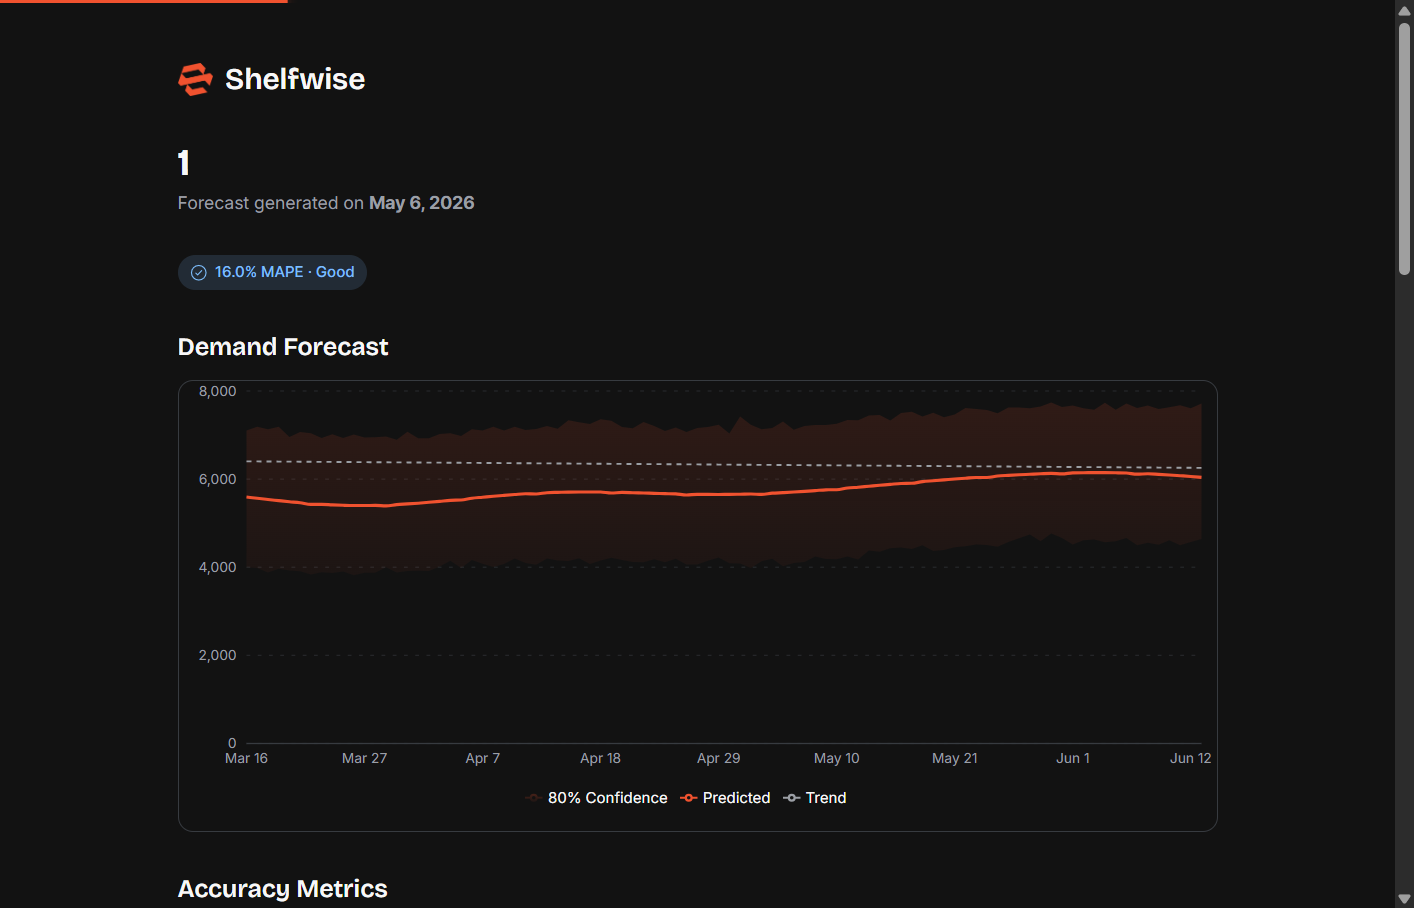
Demand chart
The chart plots your historical sales alongside the predicted demand curve. Shaded bands represent the confidence interval — the wider the band, the less certain the model is about that period. Hover over any point to see the exact predicted value and bounds.
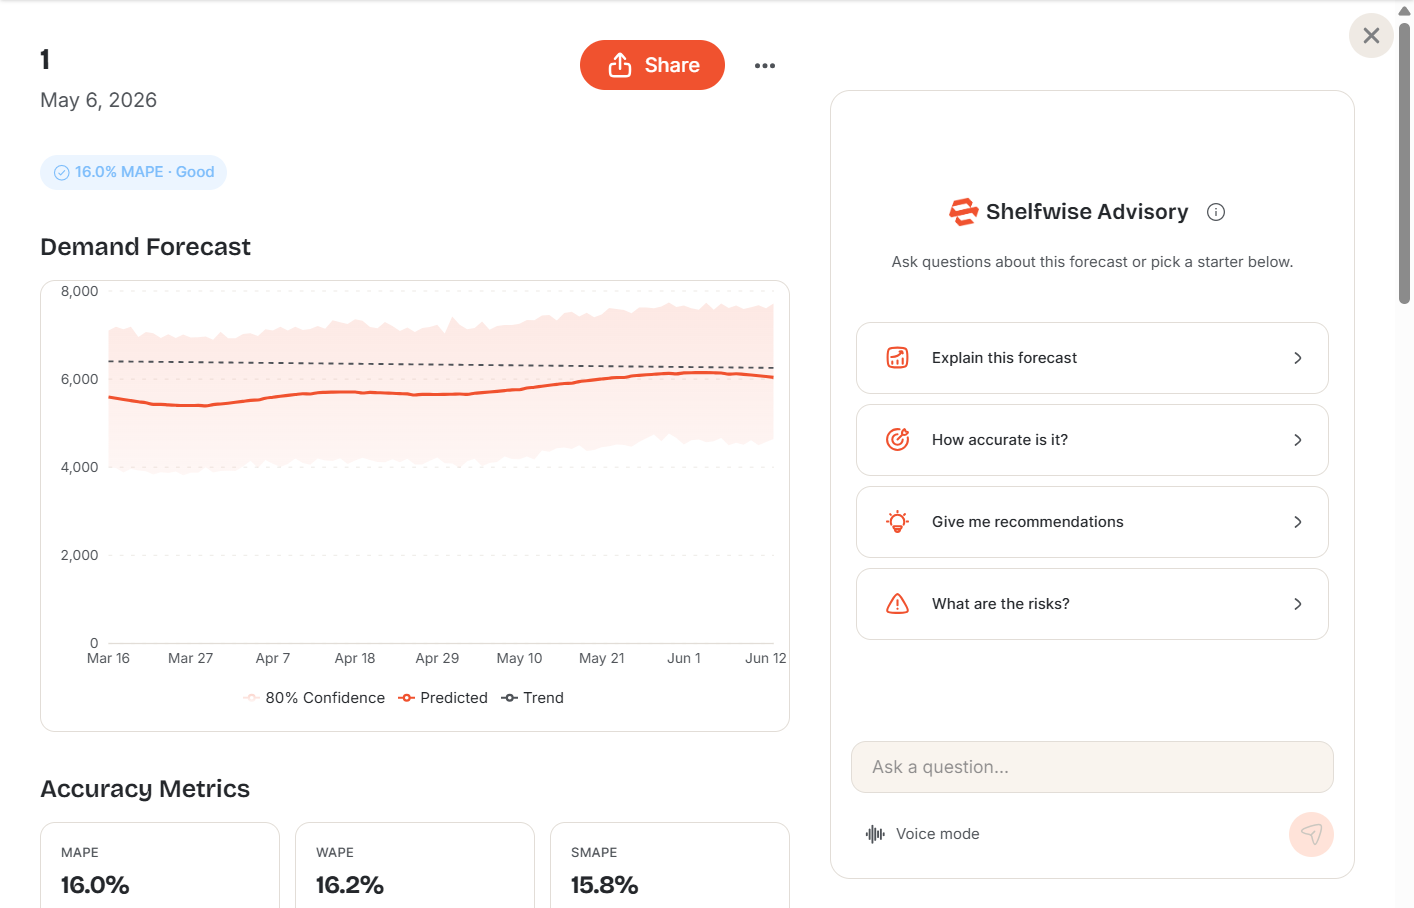
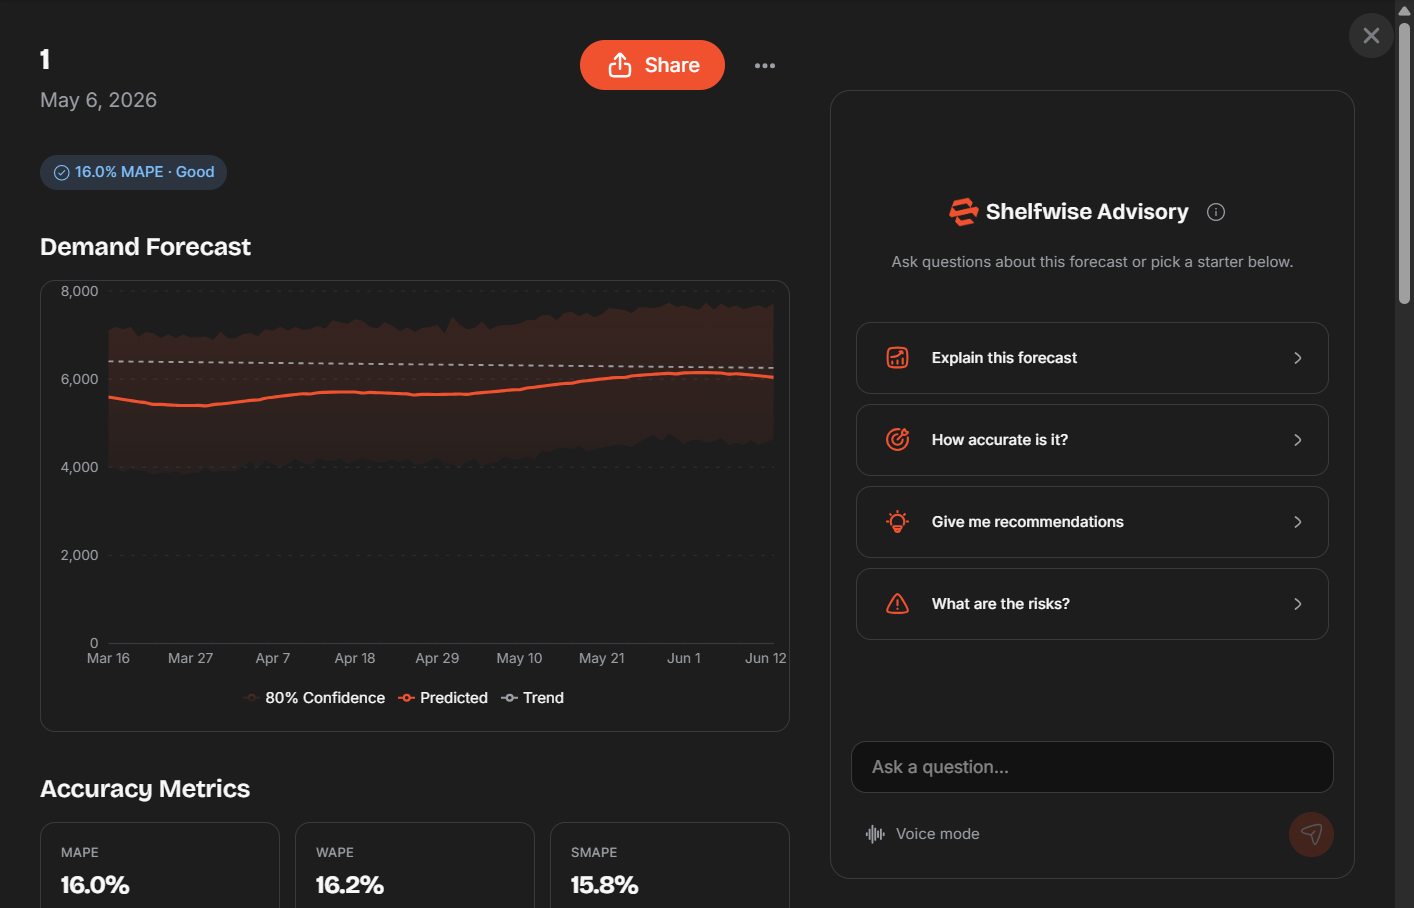
Accuracy metrics
Six accuracy metrics are calculated against a hold-out portion of your historical data, so you can judge how reliable the forecast is before acting on it:
- MAPE — Mean Absolute Percentage Error; lower is better.
- WAPE — Weighted Absolute Percentage Error; accounts for volume differences across periods.
- SMAPE — Symmetric MAPE; treats over- and under-forecasting equally.
- MASE — Mean Absolute Scaled Error; compares the model against a naïve baseline — values below 1 mean the model outperforms the baseline.
- RMSE — Root Mean Squared Error; penalises large errors more heavily than small ones.
- MAE — Mean Absolute Error; the average magnitude of forecast errors in original units.
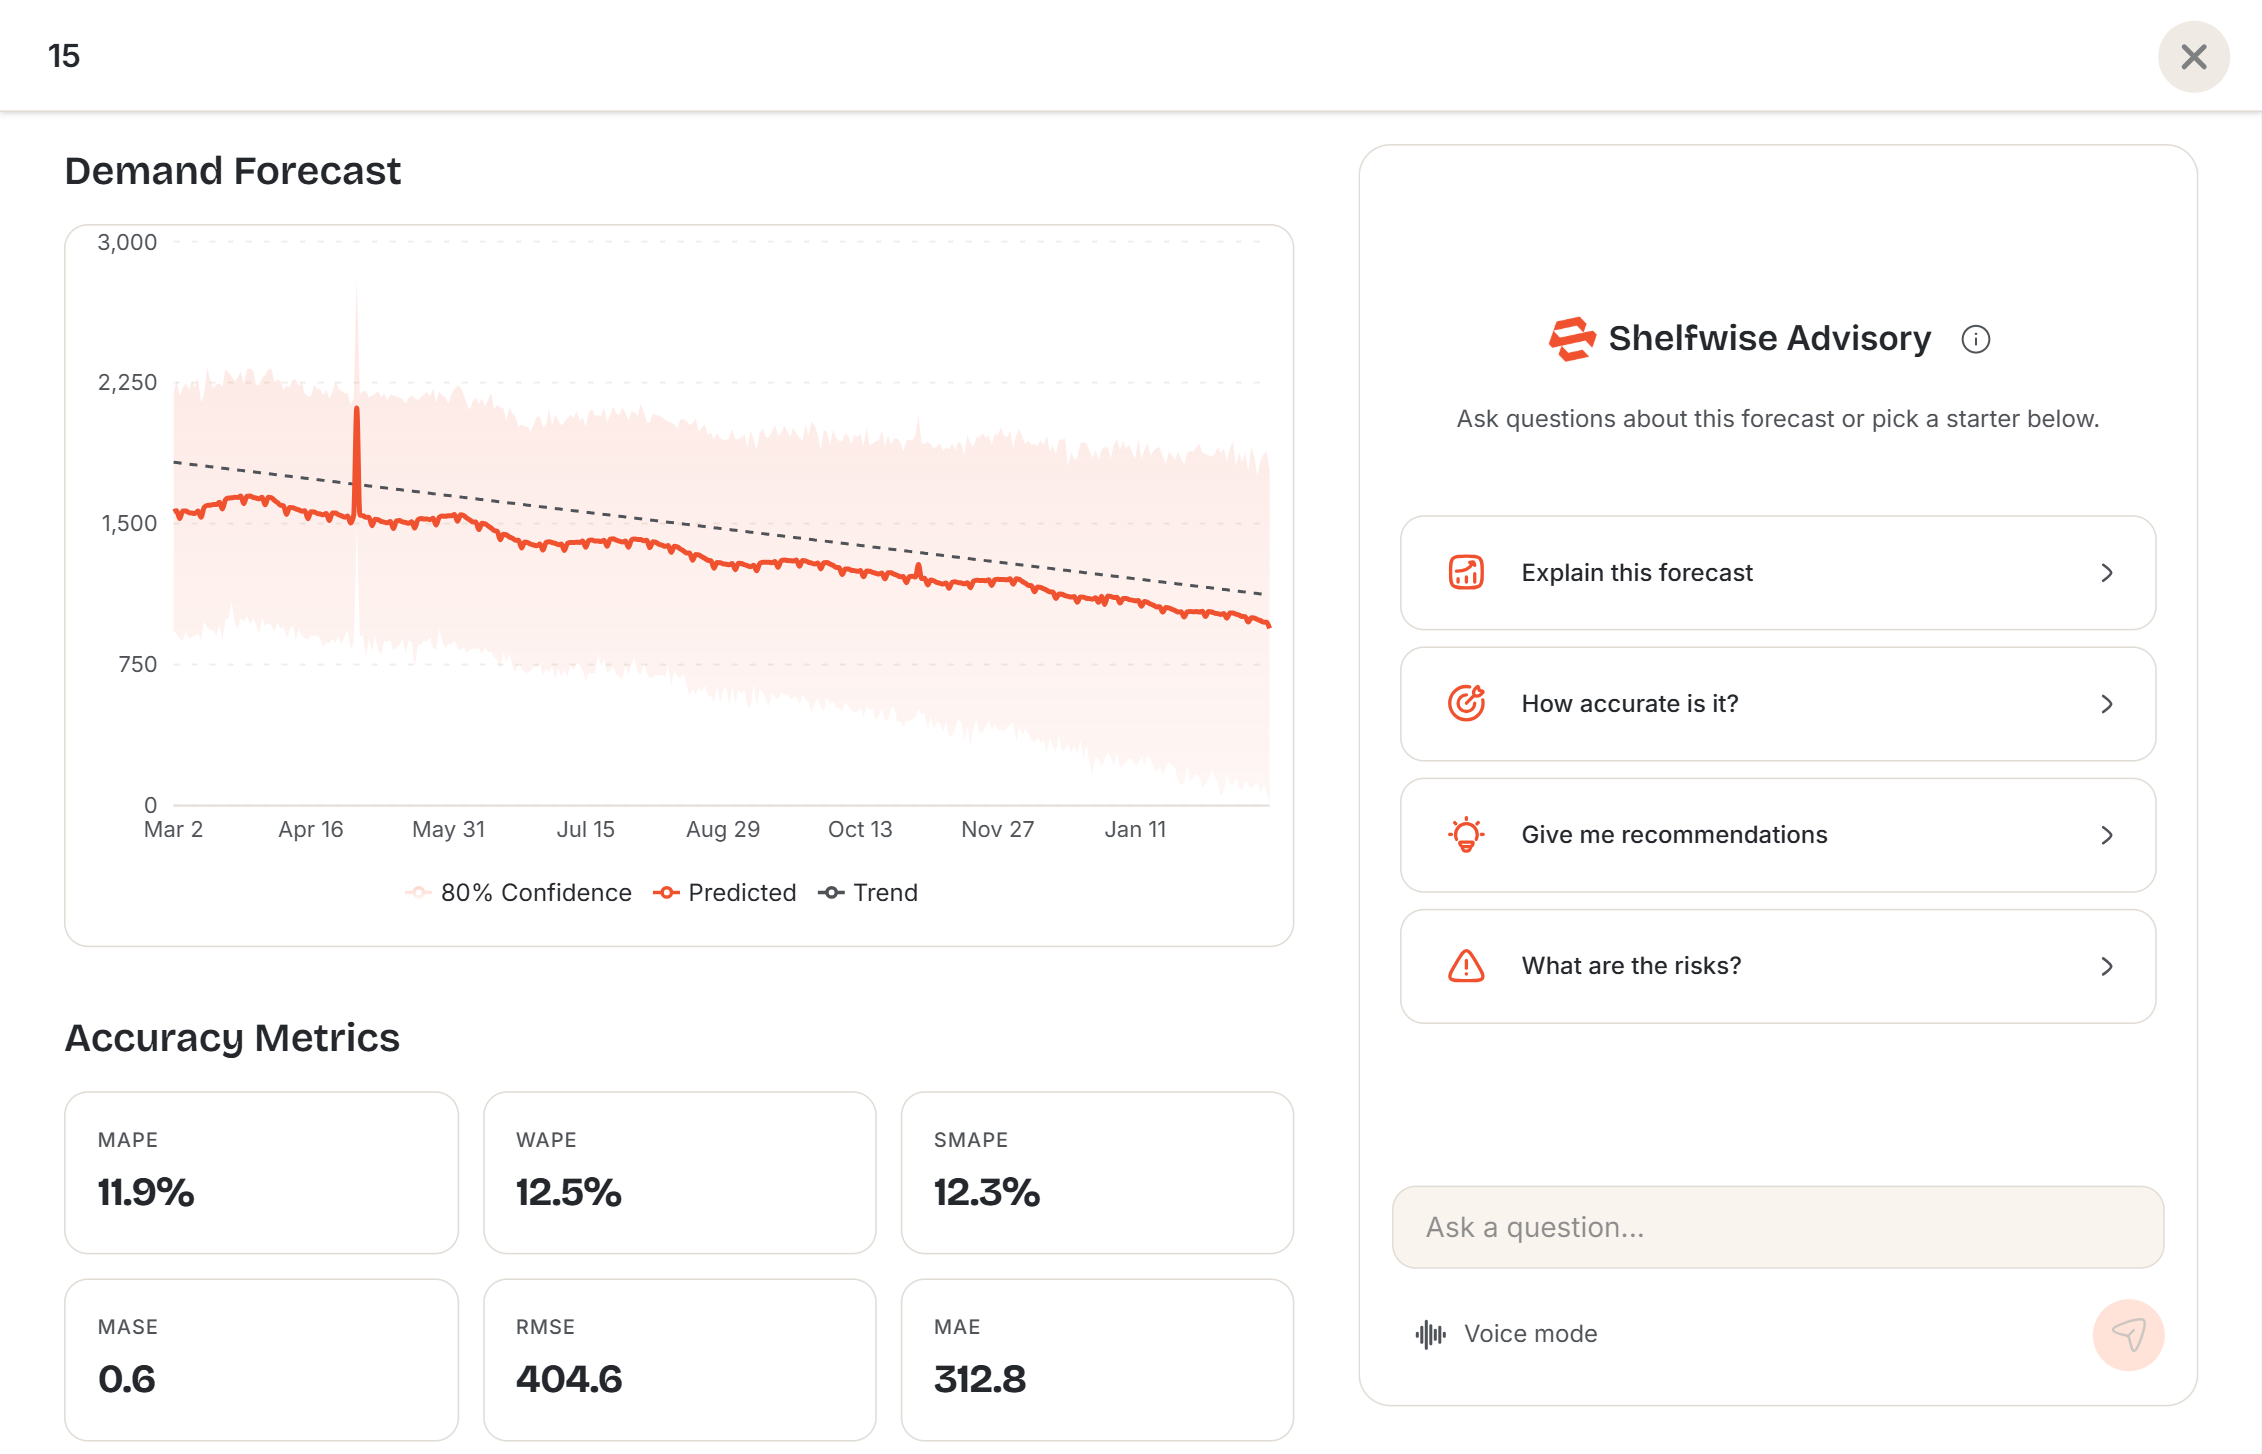
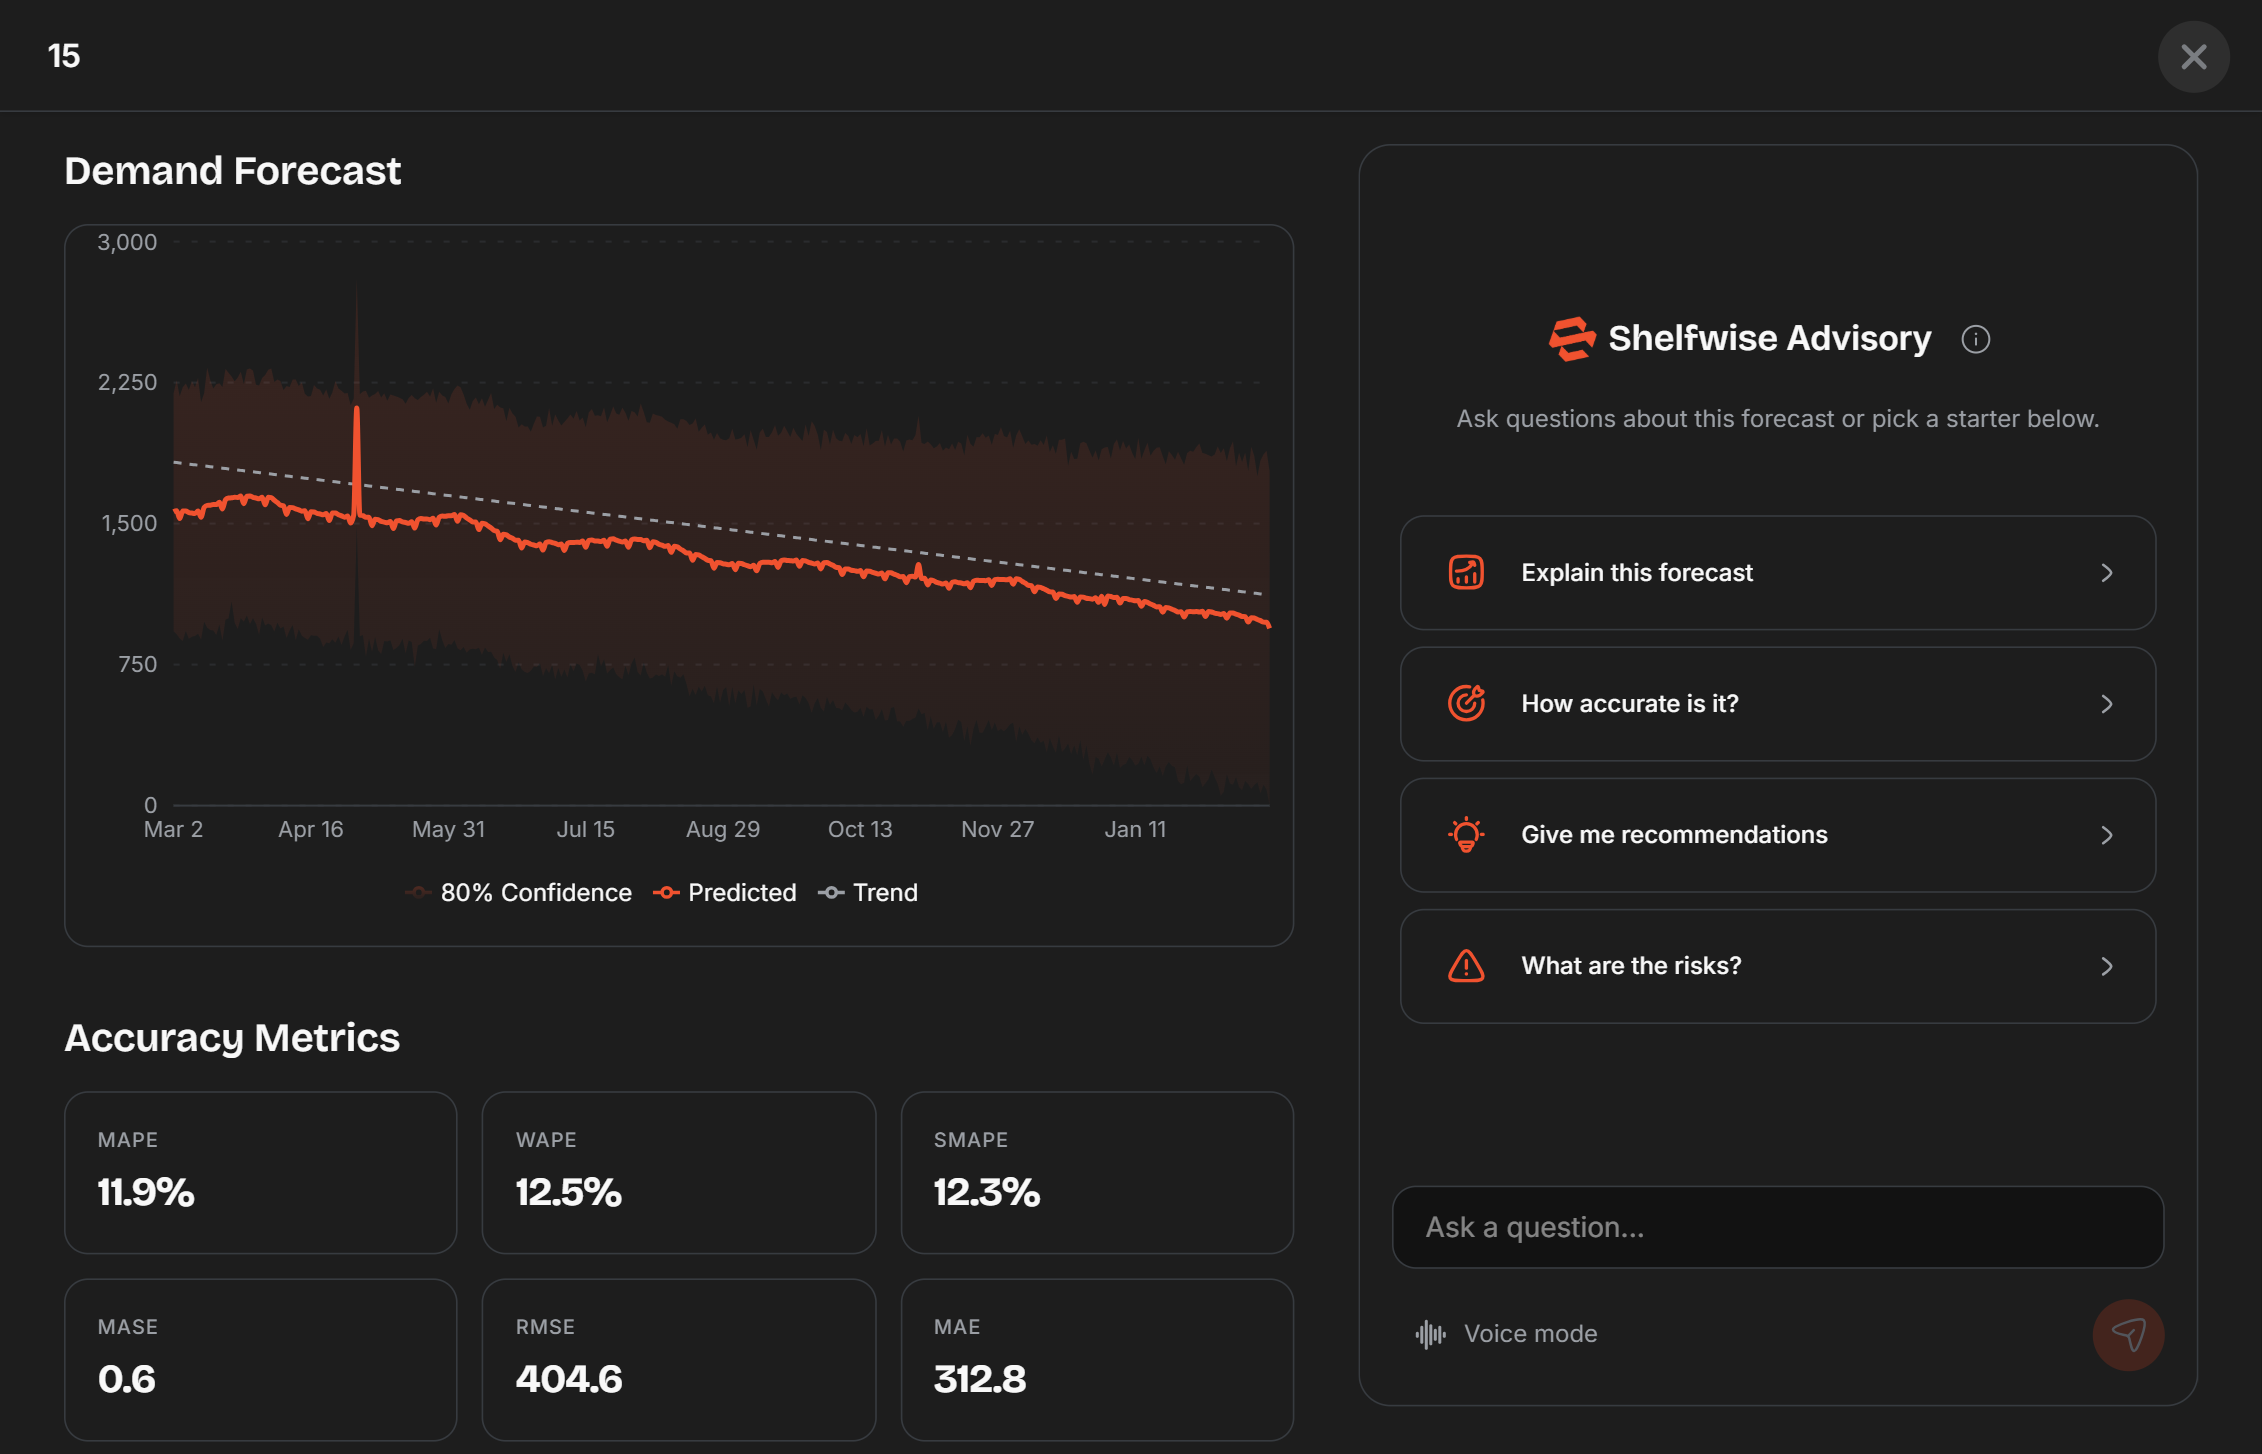
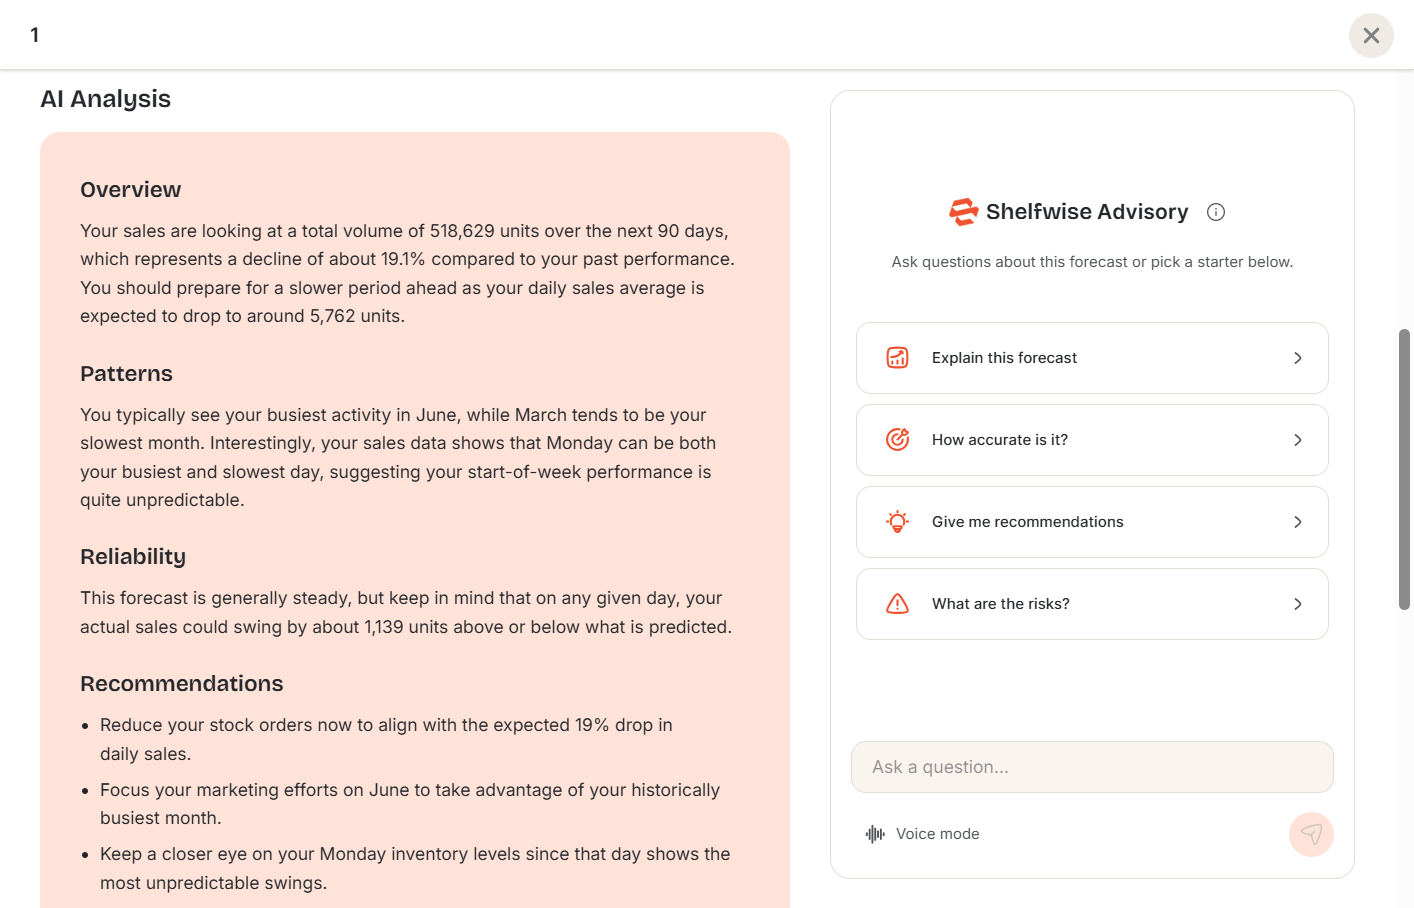
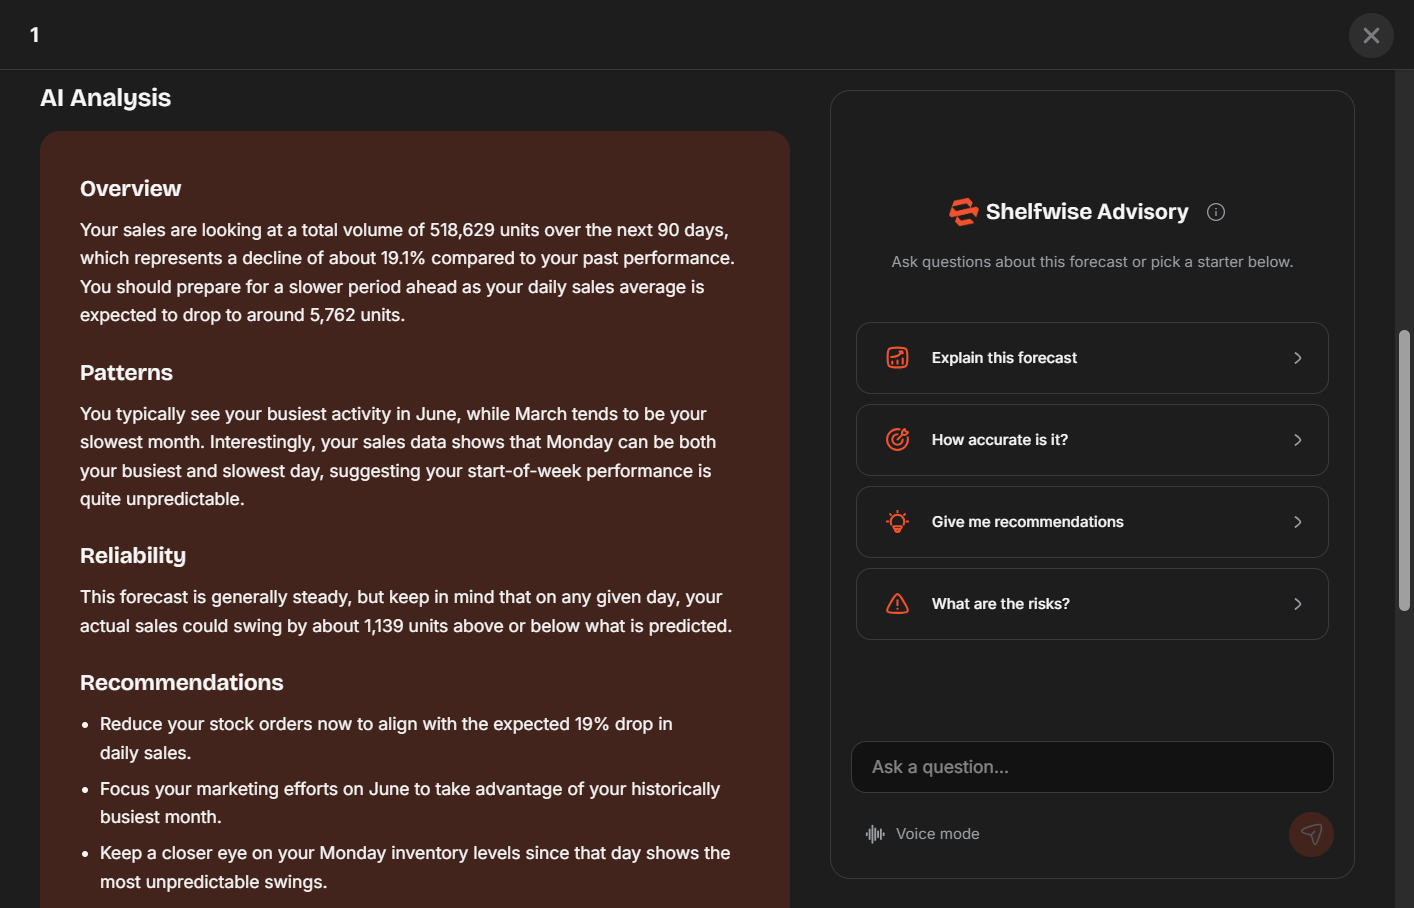
AI analysis
Below the metrics, an AI-generated analysis explains the key patterns detected in your data — trends, seasonal cycles, anomalies, and a plain English interpretation of what the forecast means for your restocking decisions.
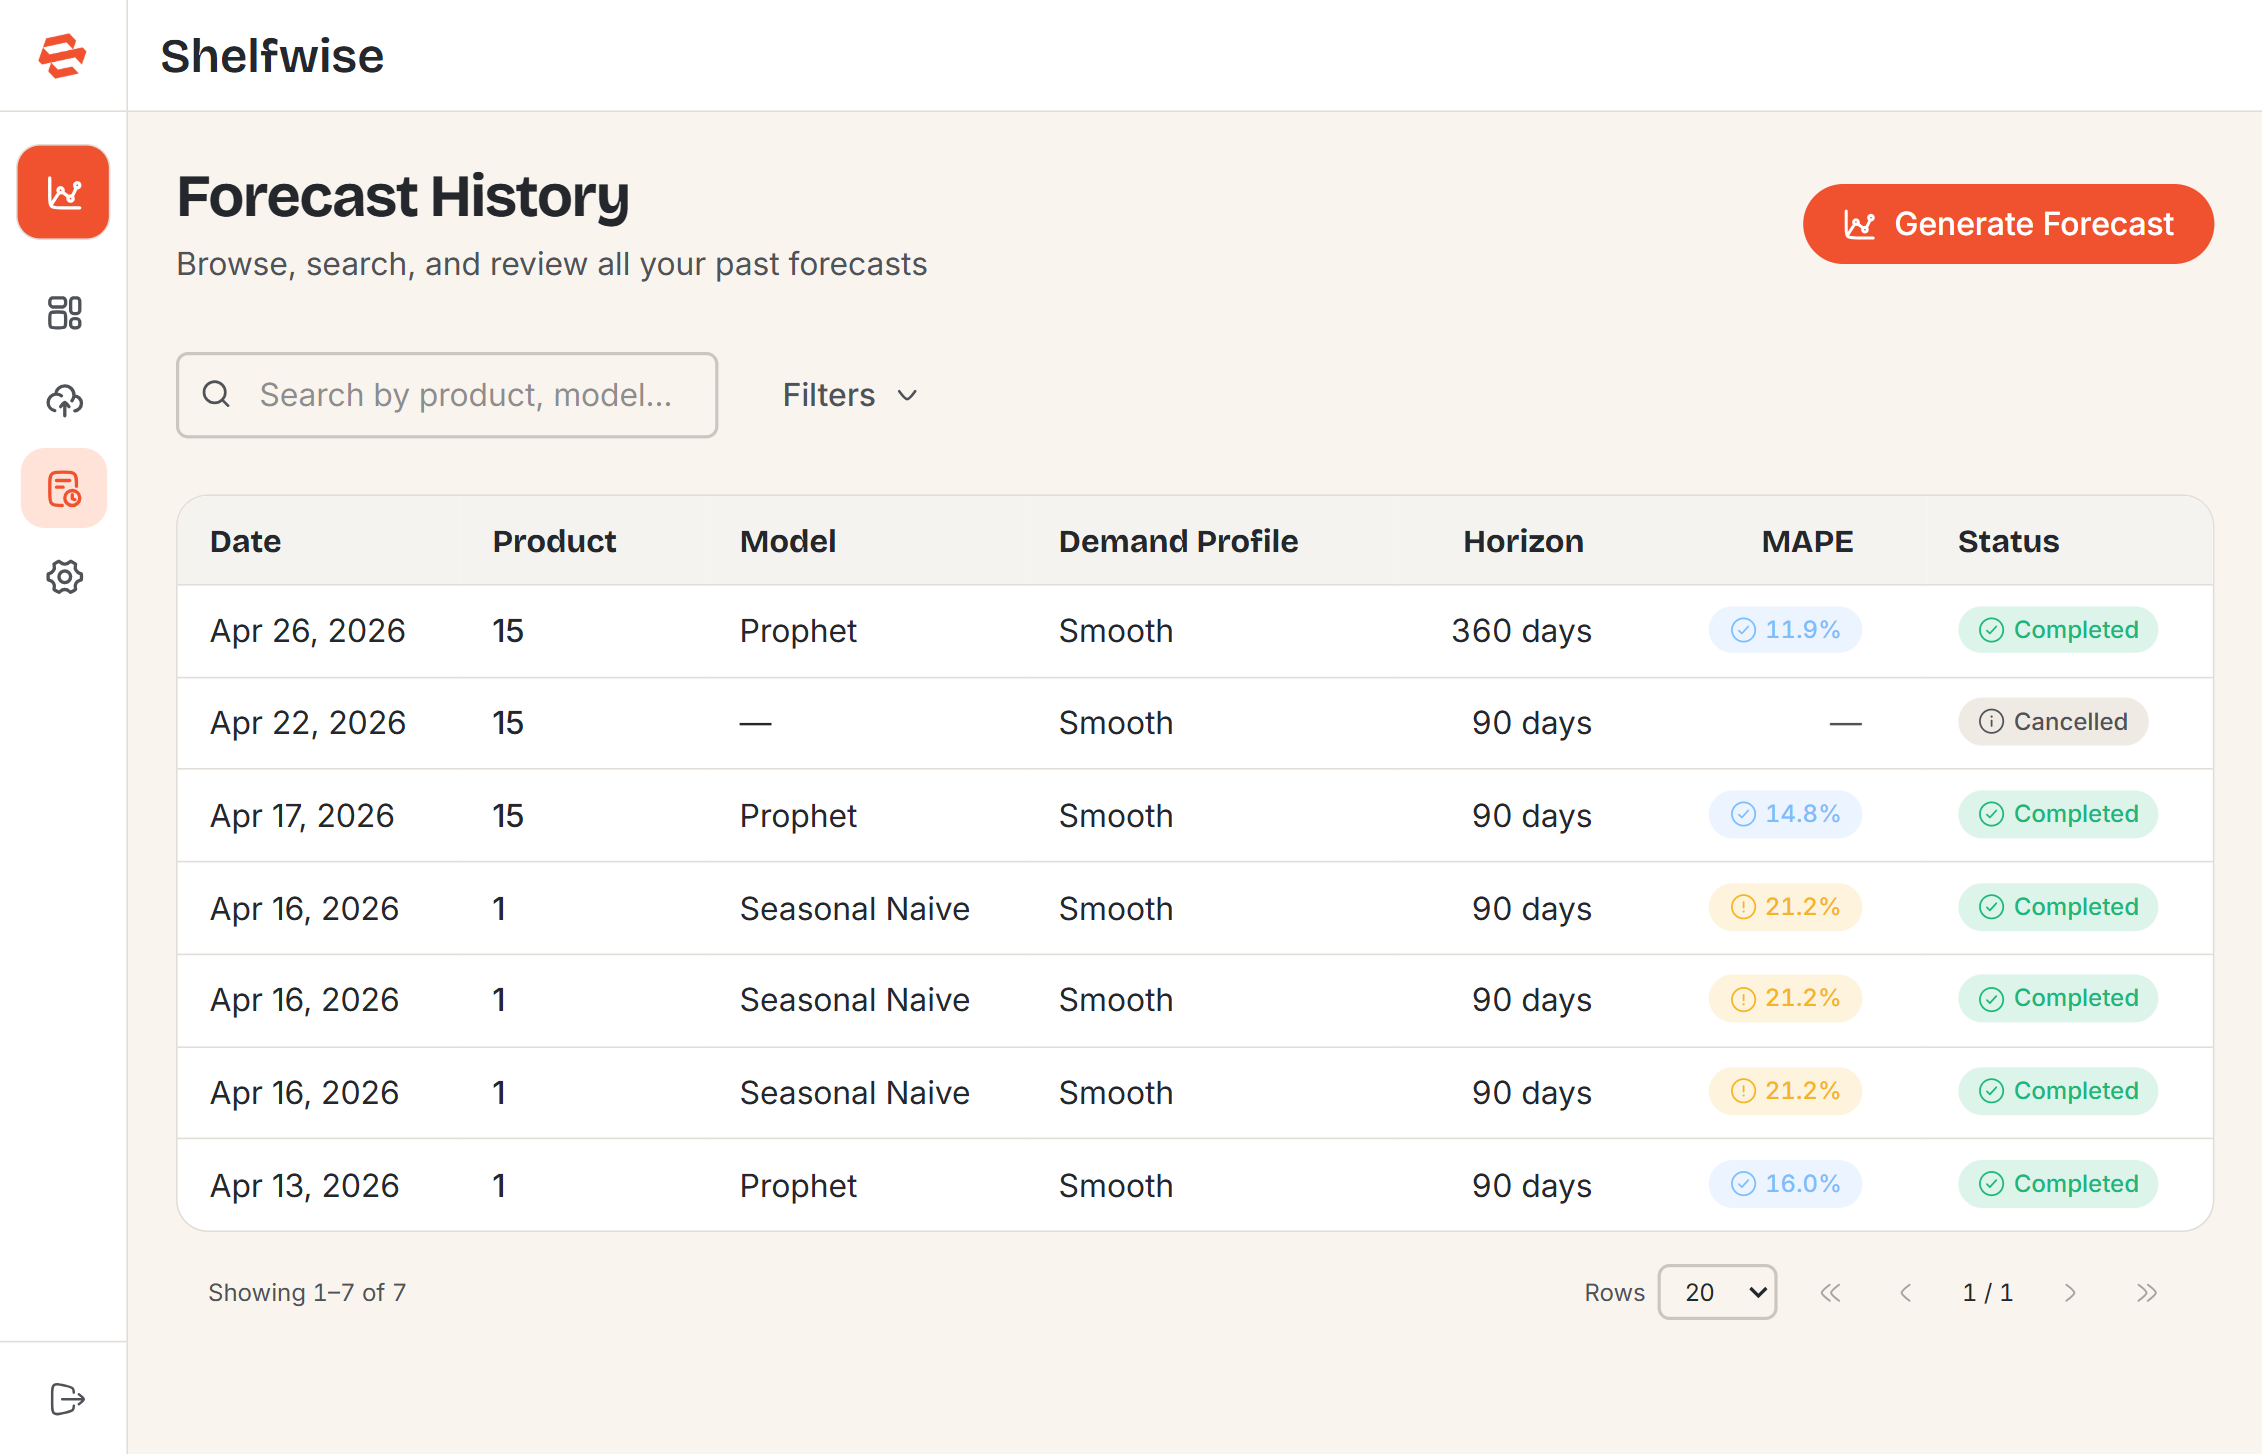
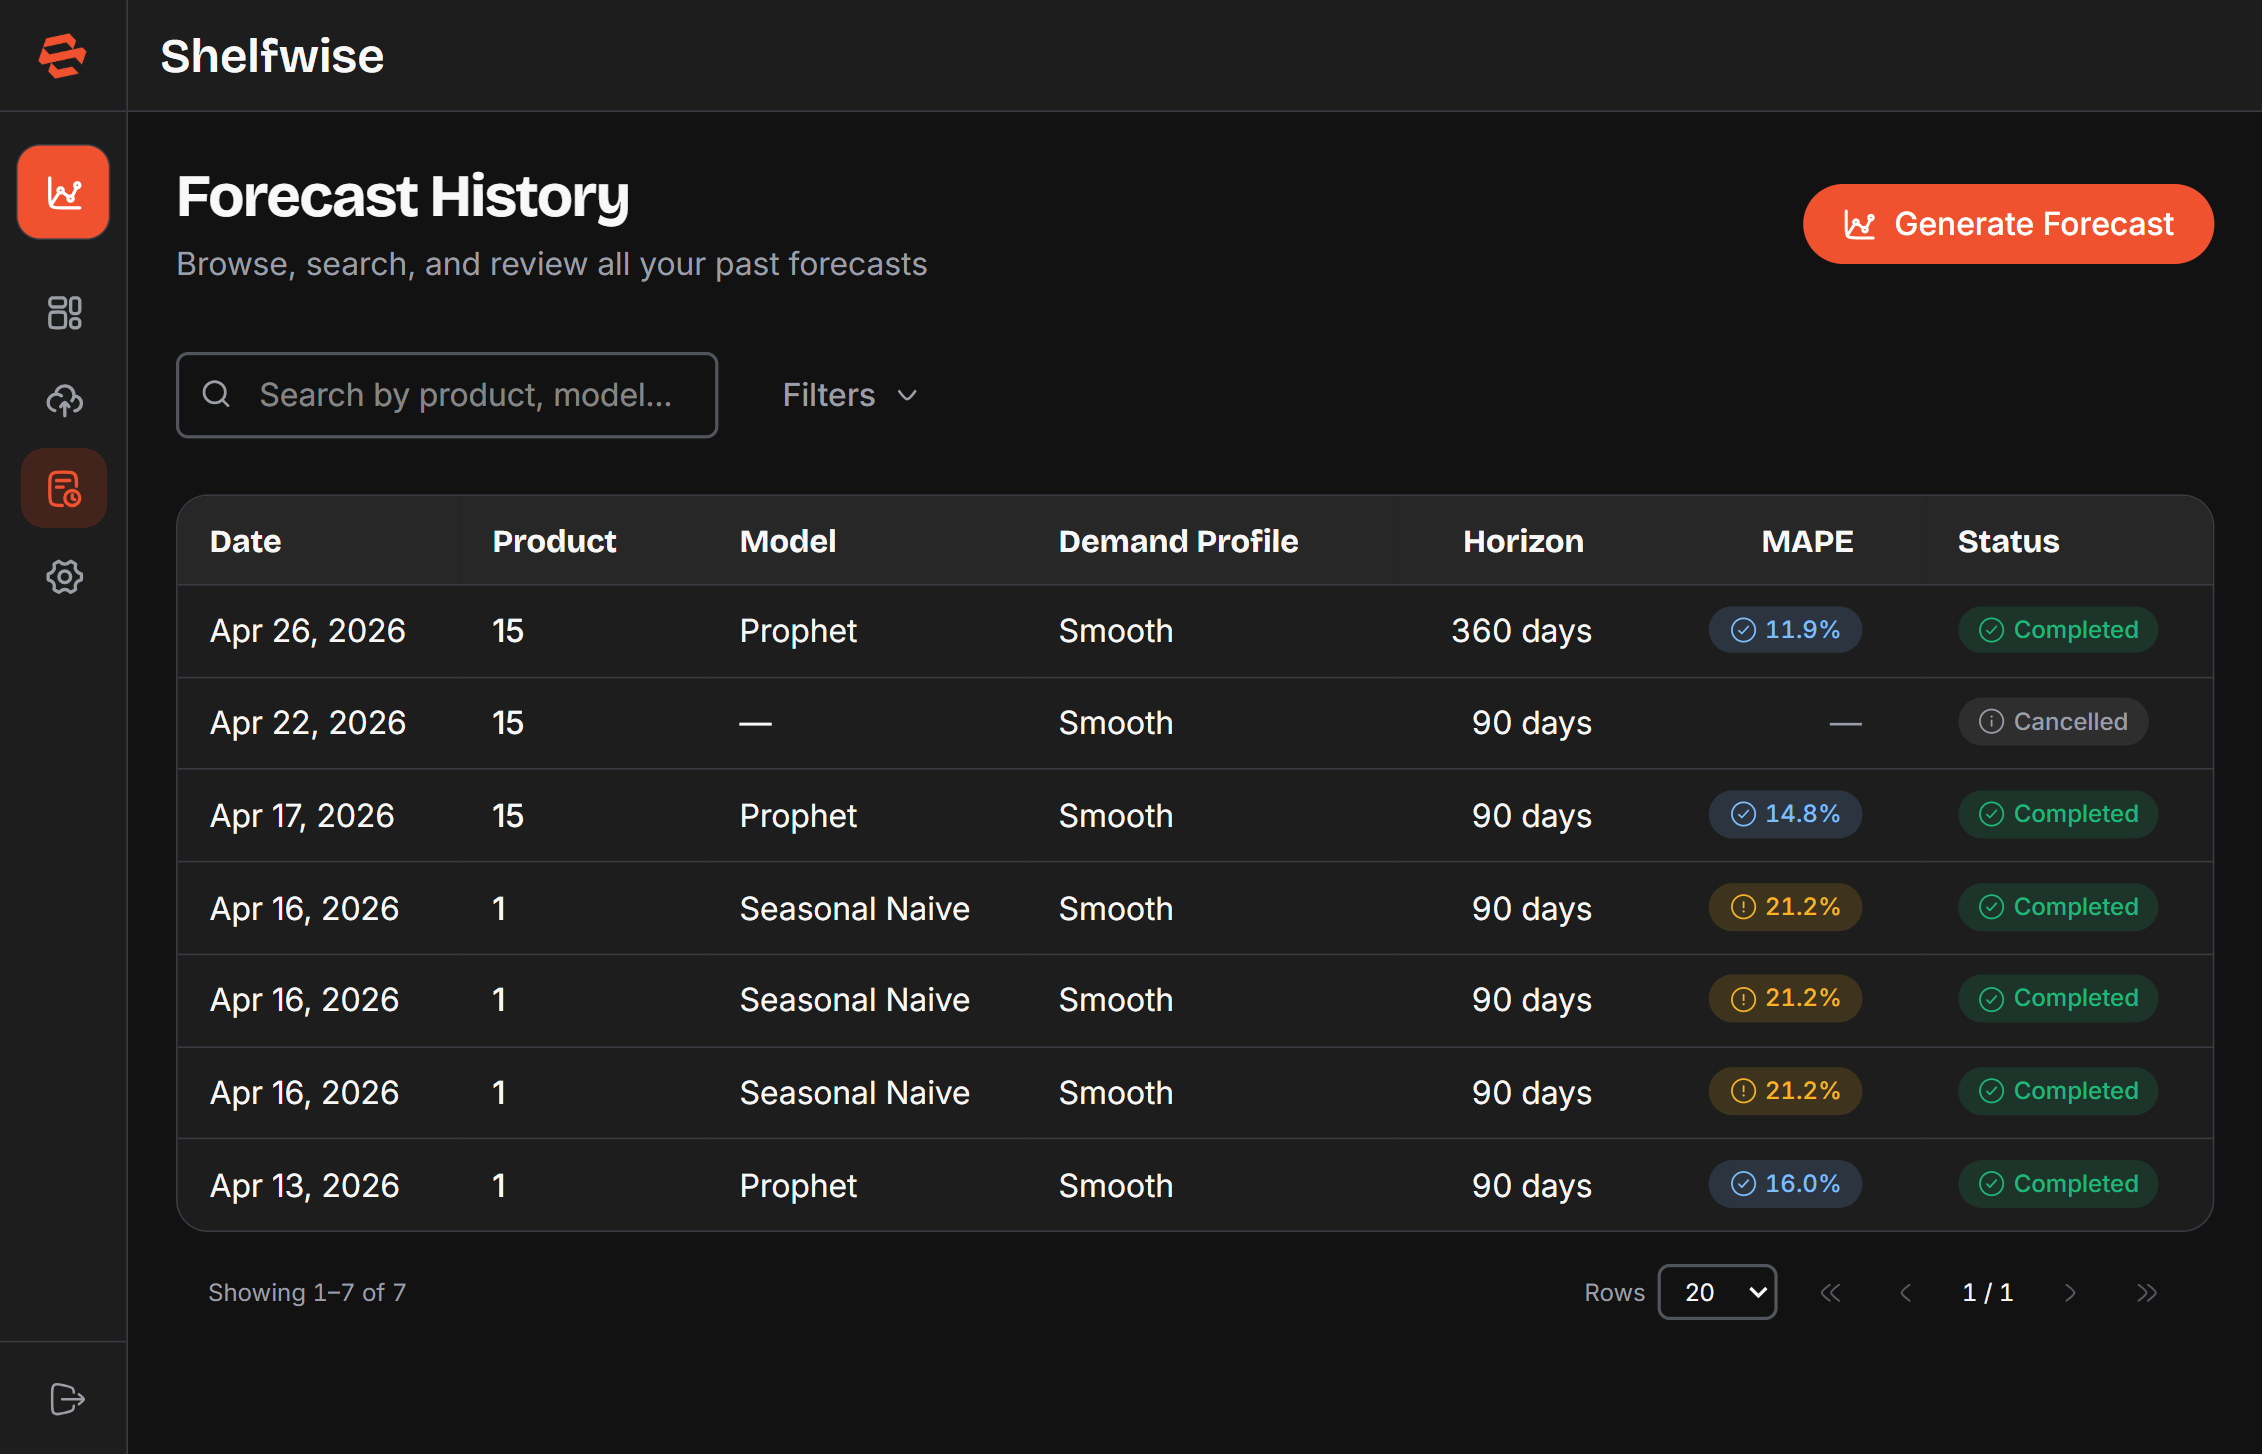
Forecast History
The Forecast History page lists every forecast you have generated. Each row shows the product name, the model used, the date generated, the forecast horizon, and a status badge.
Status types
- Completed — the forecast finished successfully and results are available.
- Processing — the forecast is currently being generated.
- Failed — the forecast could not be completed, usually due to insufficient data.
- Cancelled — the forecast was stopped before completion.
Filtering and searching
Use the search bar to find forecasts by product name, or apply filters to narrow results by model type, status, or date range. Click any column header to sort the list. On smaller screens the list switches to a card layout automatically.
Click any row to open the full forecast detail page, where you can re-read the chart, metrics, and AI analysis, or download the PDF.
Sharing a Forecast
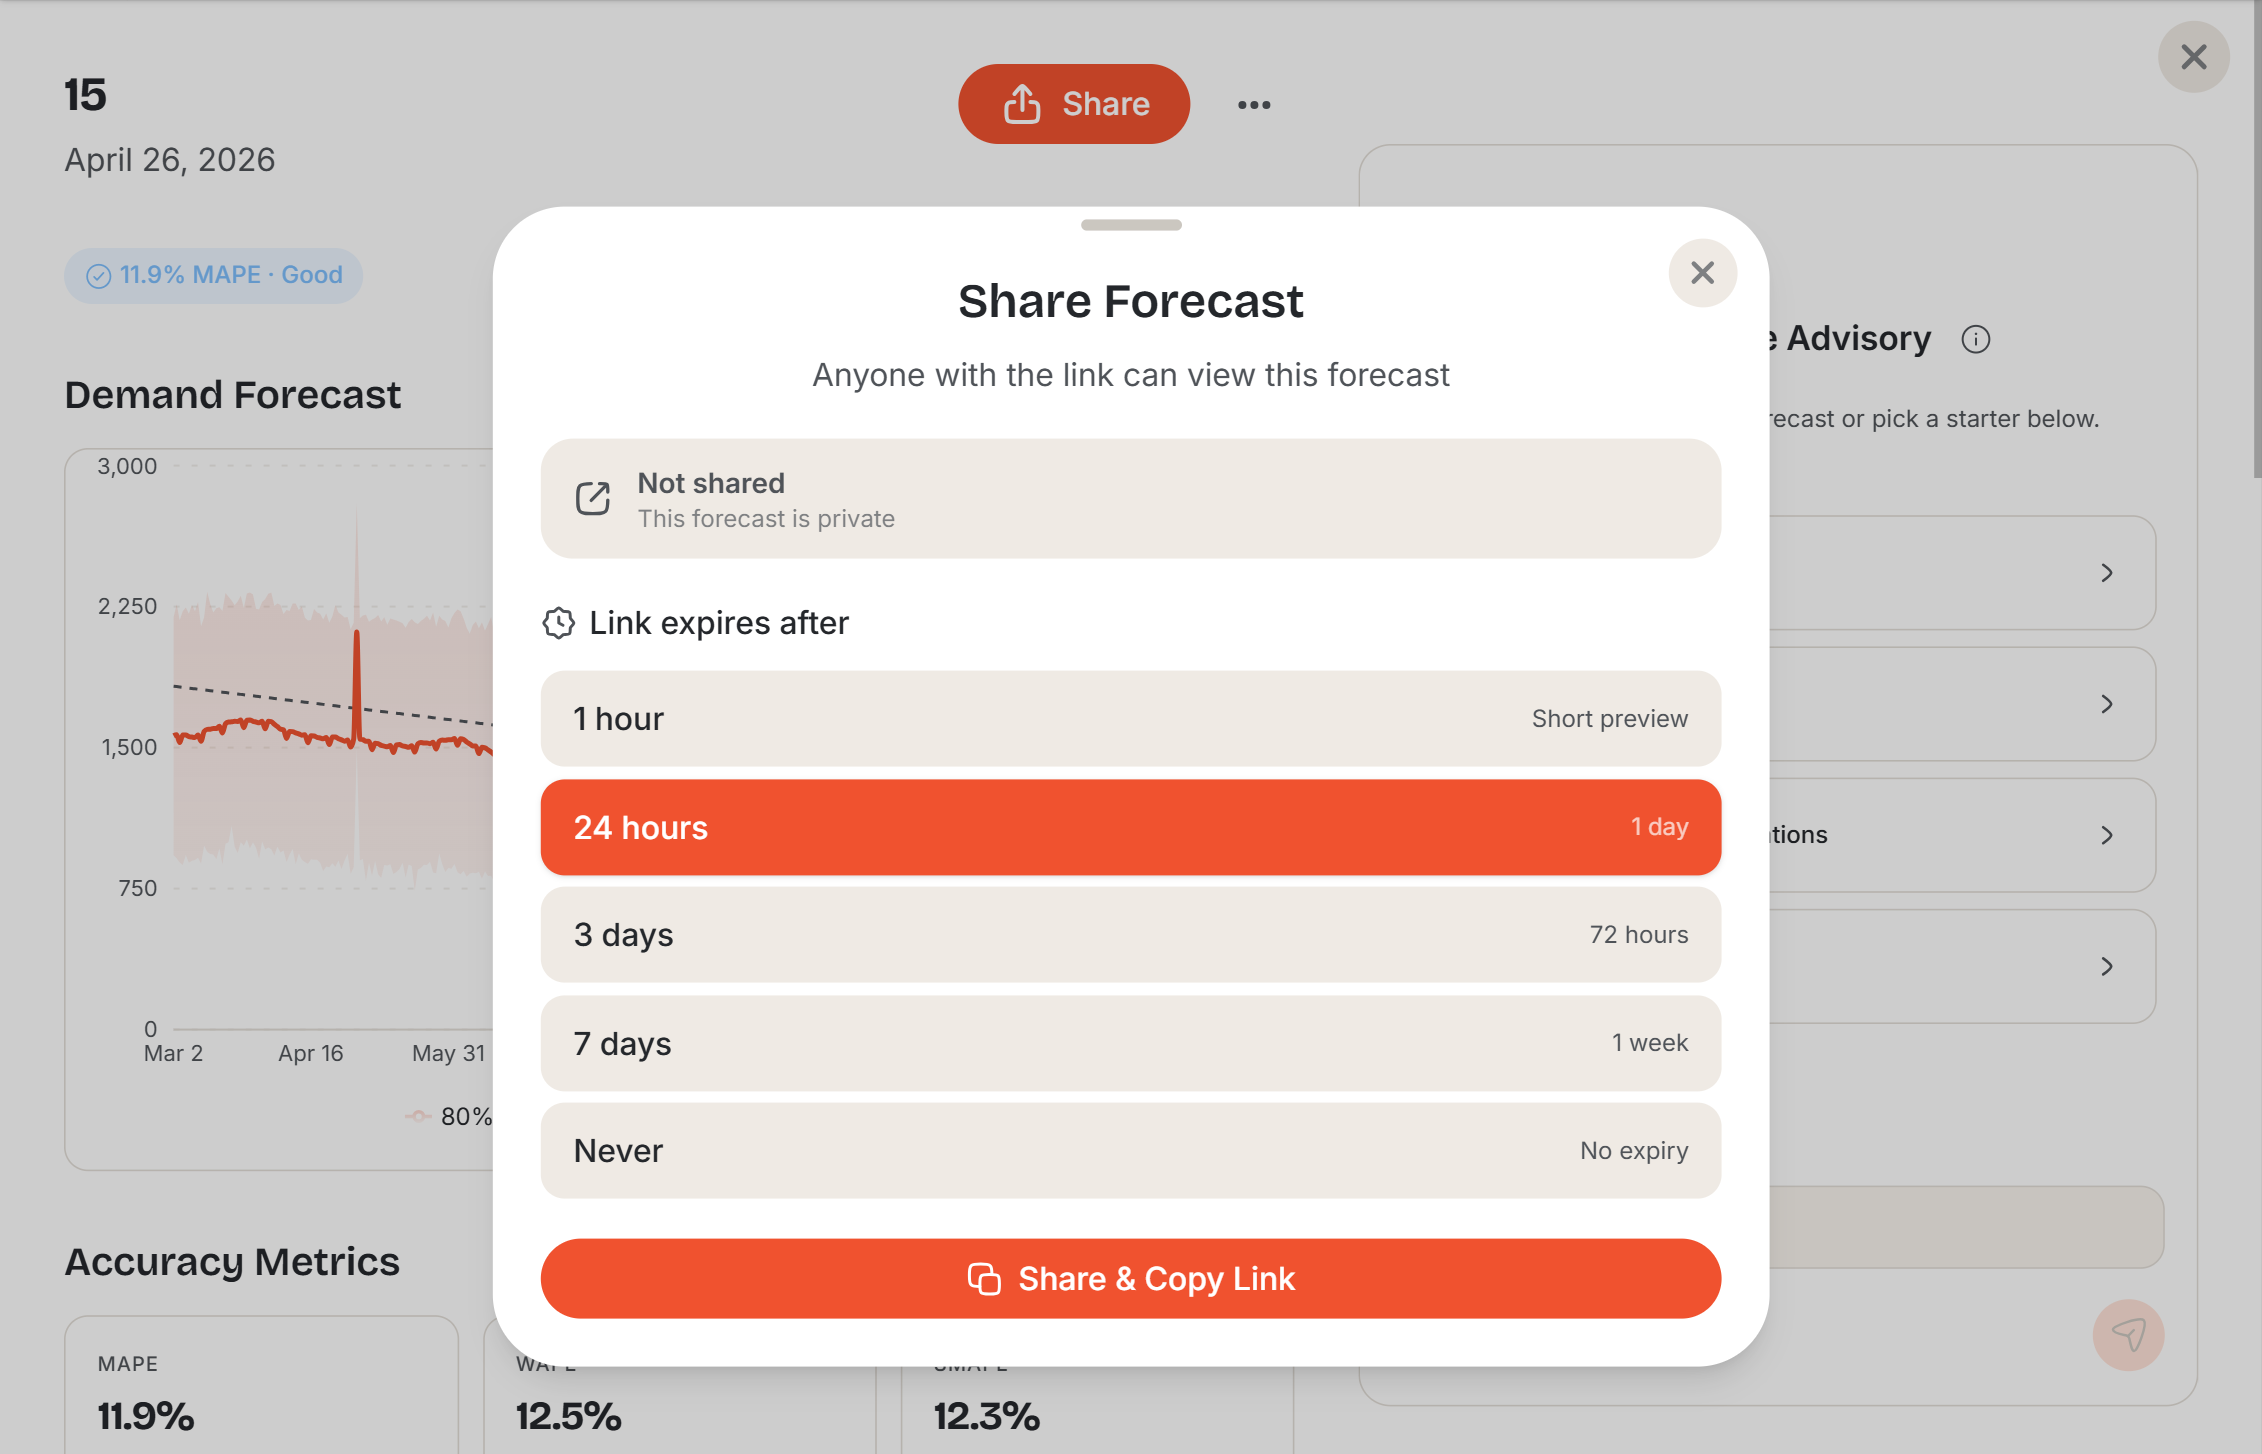
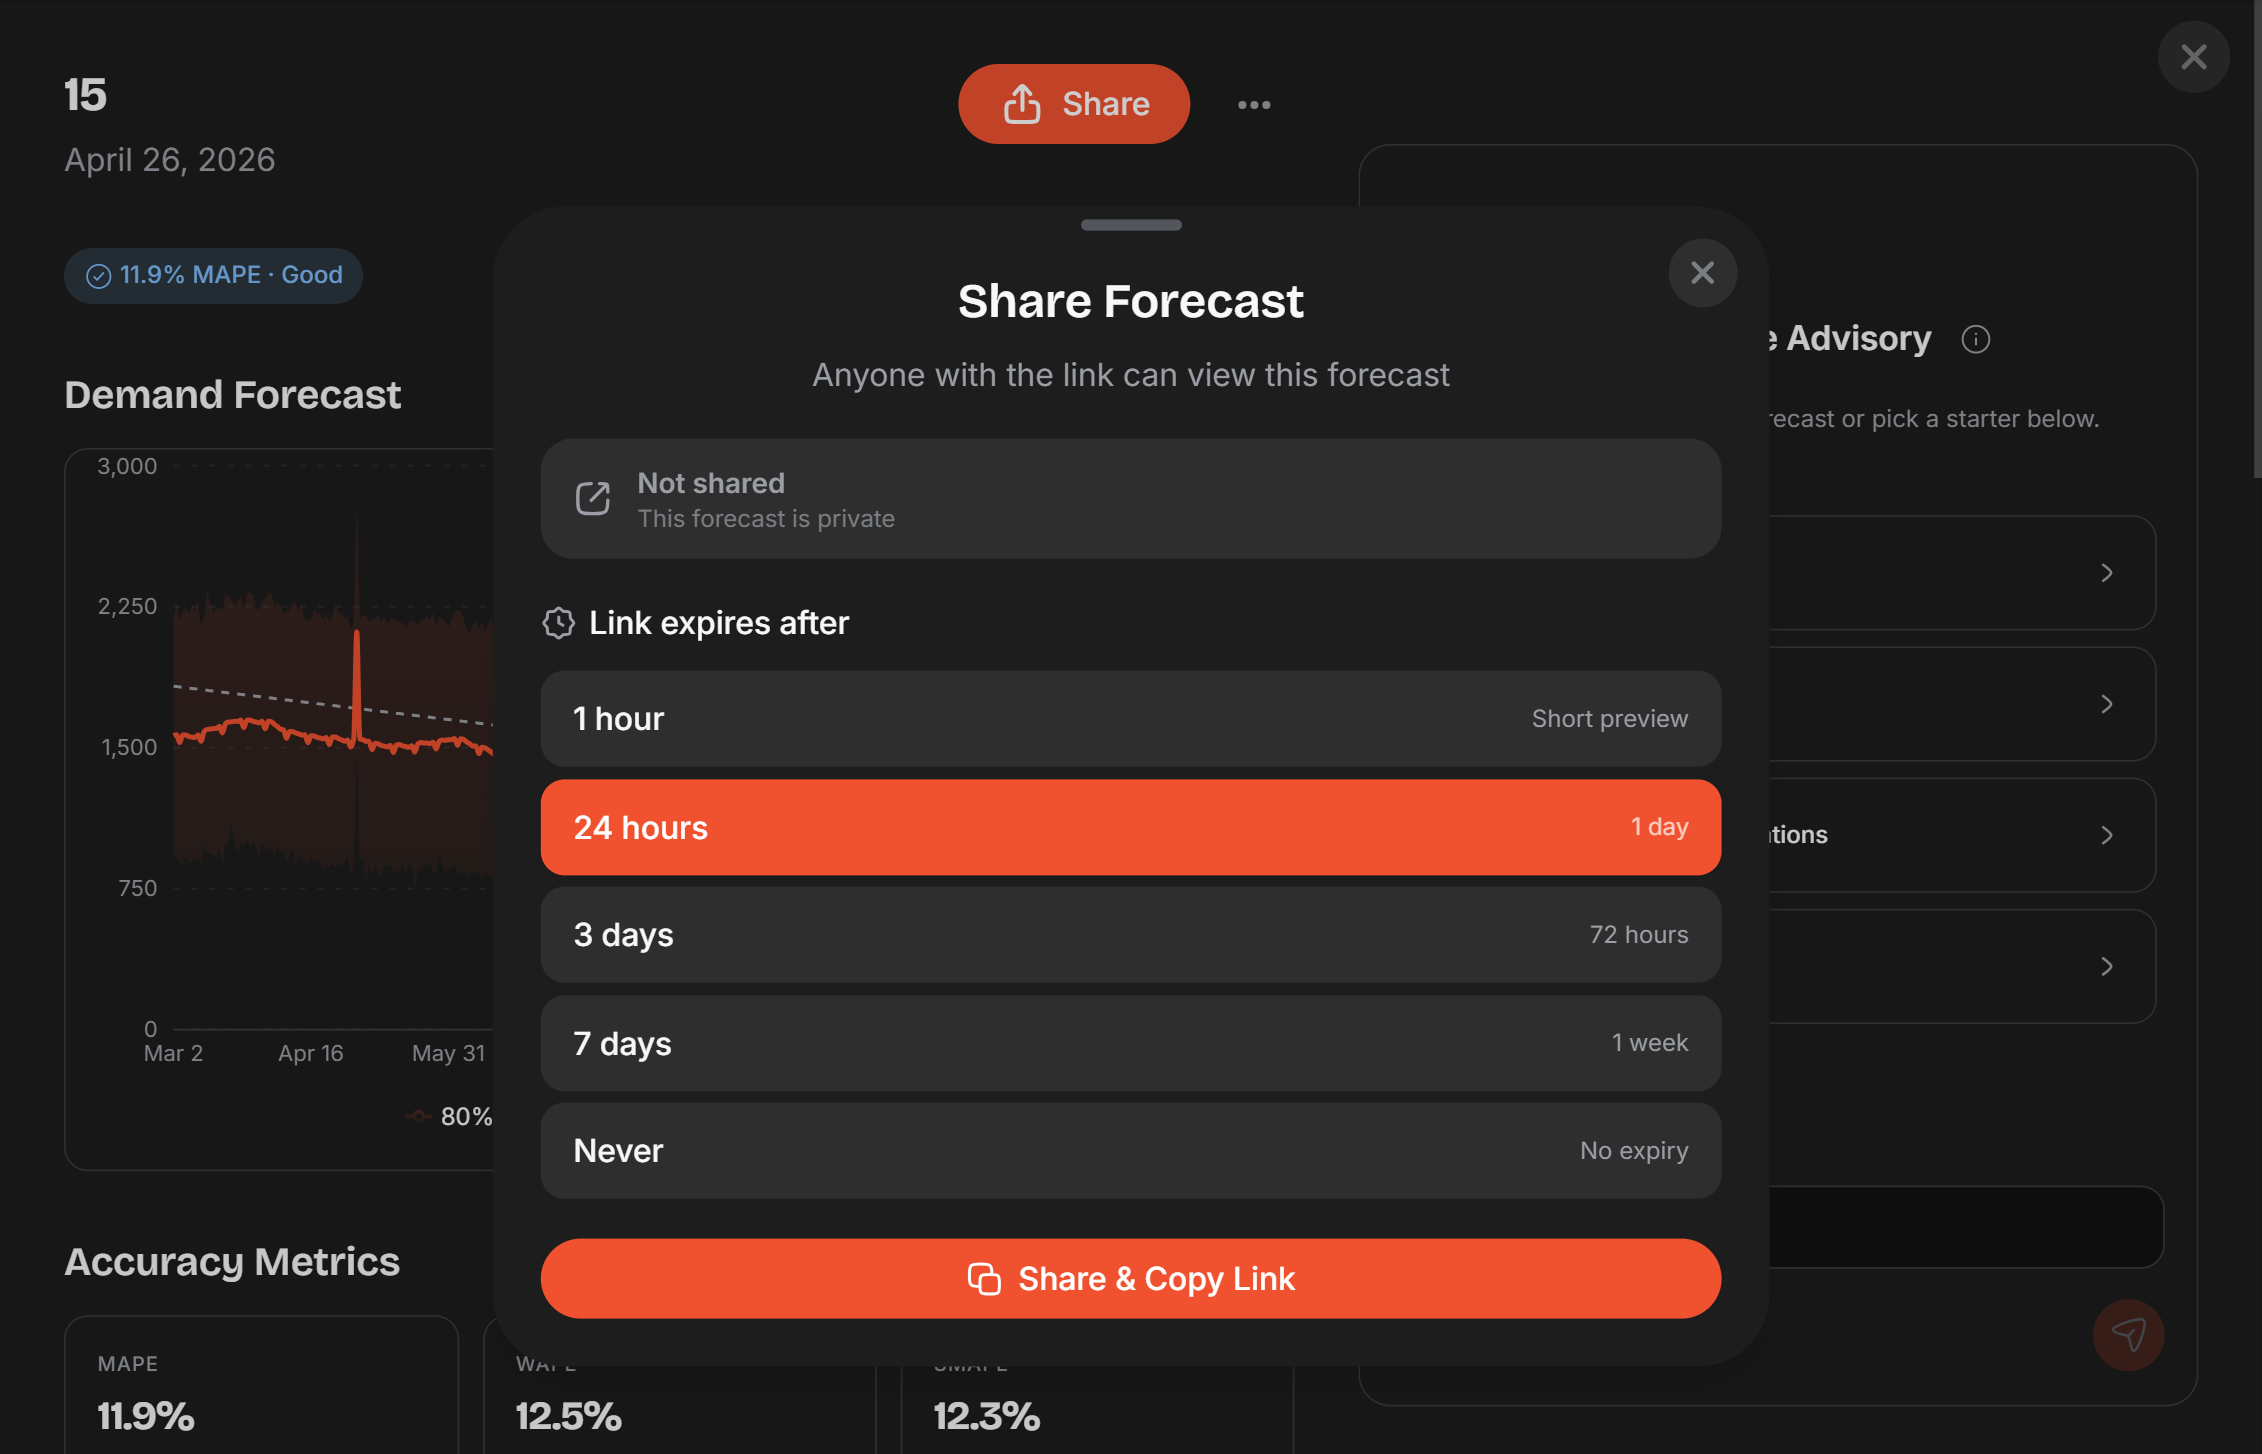
On any forecast detail page, click Share to generate a public link. Anyone with the link can view the forecast chart, accuracy metrics, AI analysis, and configuration details — without needing a Shelfwise account. This is useful for sharing results with suppliers, buyers, or other stakeholders.
The shared page is read-only. To stop sharing, return to the forecast detail page and revoke the link — the previous URL will immediately stop working.
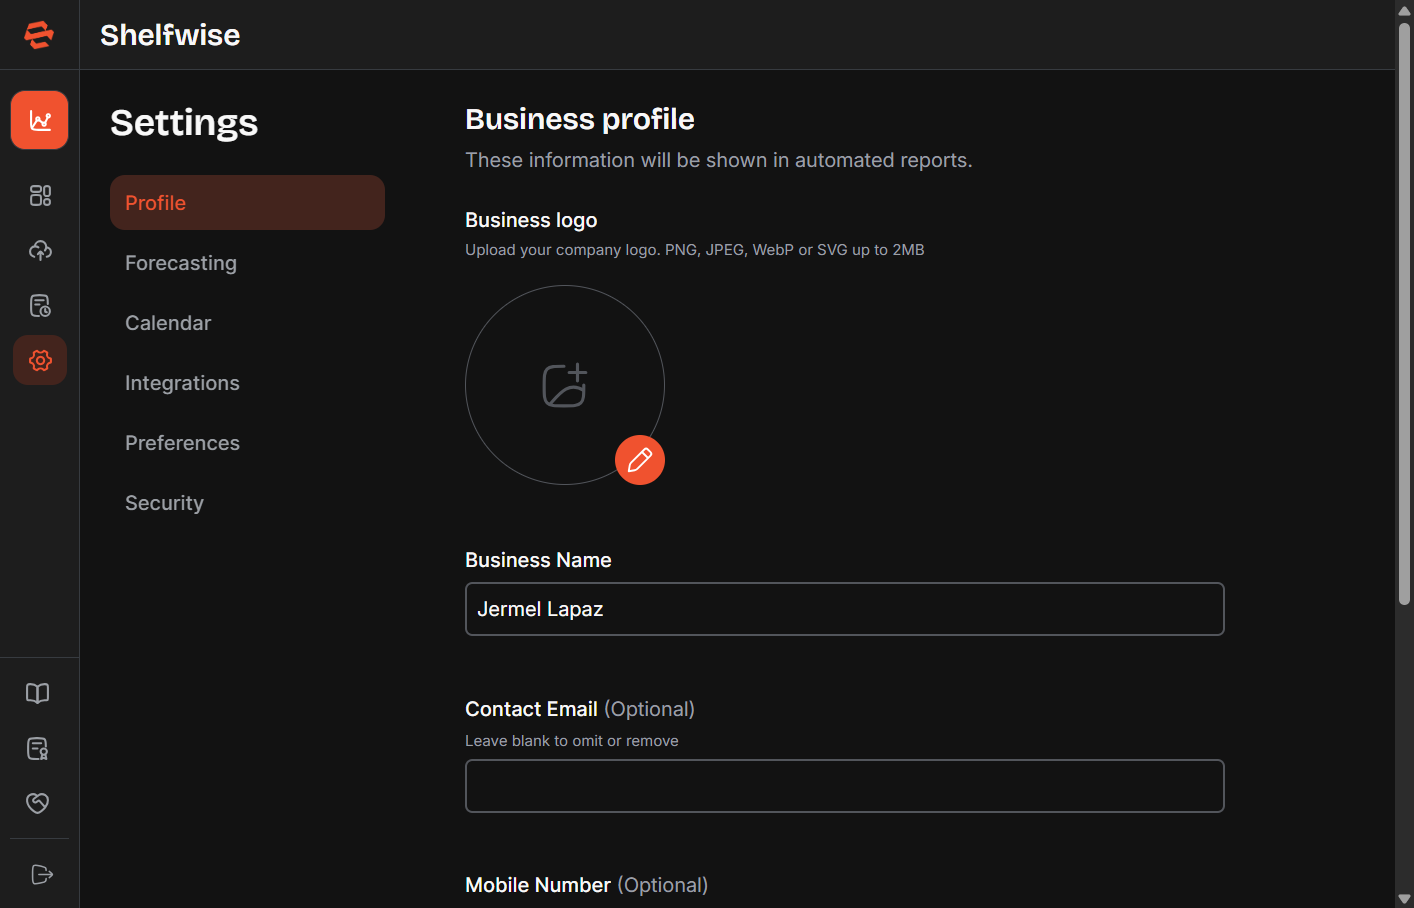
Settings
Access Settings from the sidebar to manage every aspect of your account. Settings are organised into six sections.
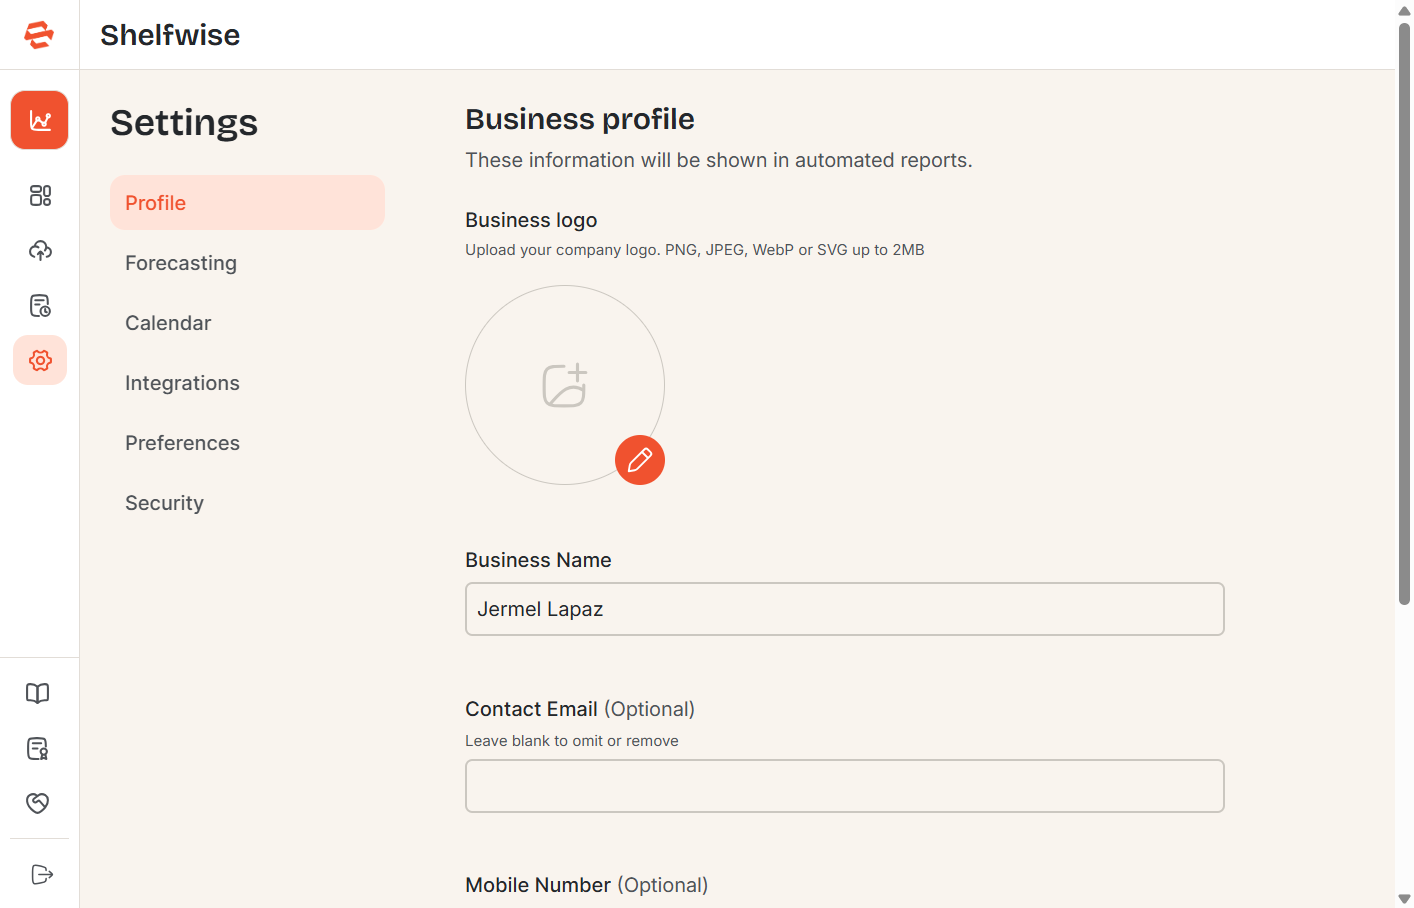
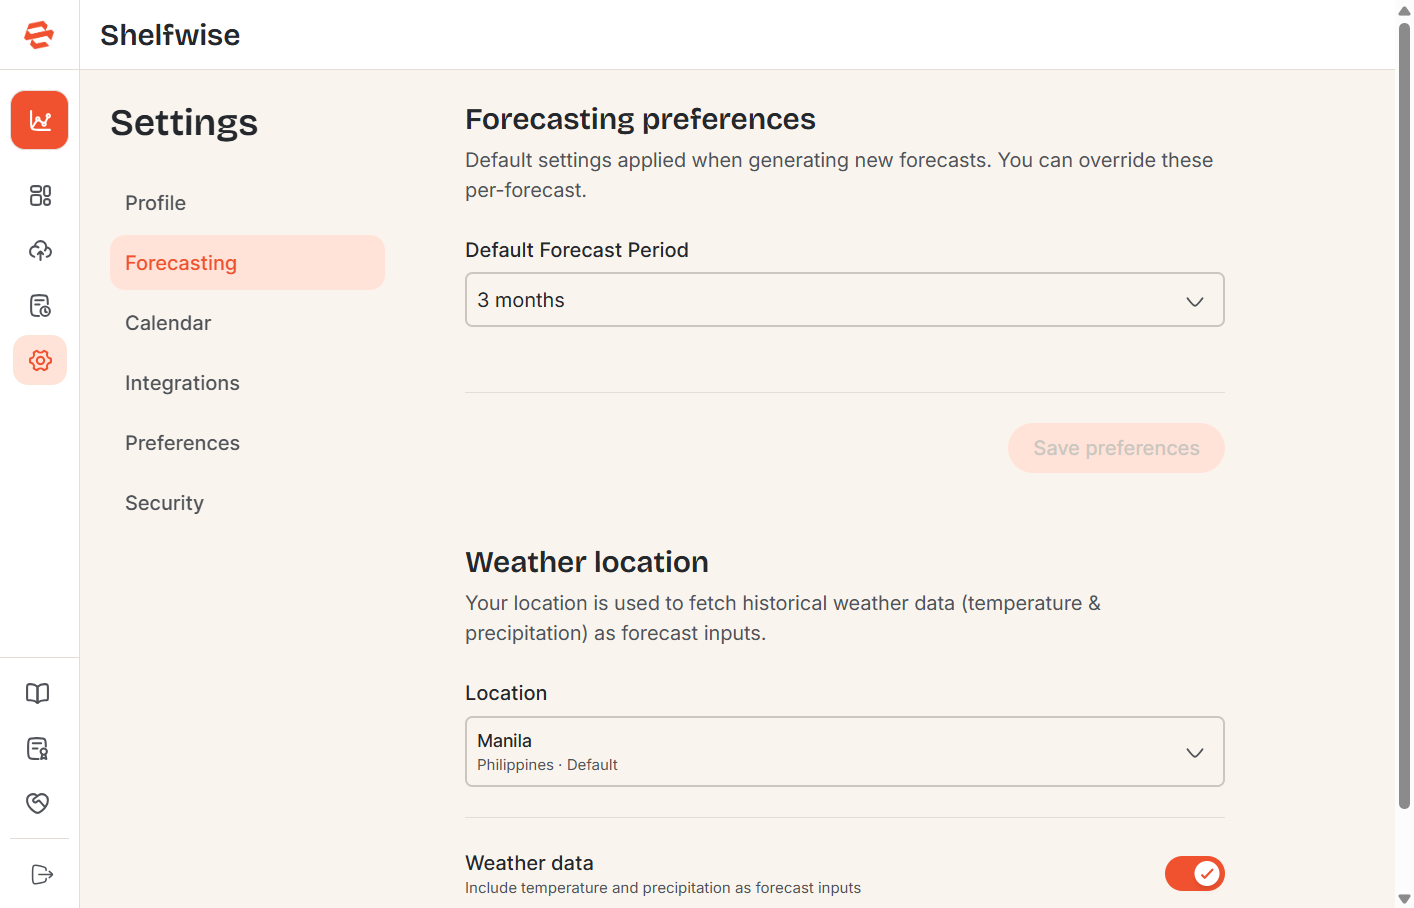
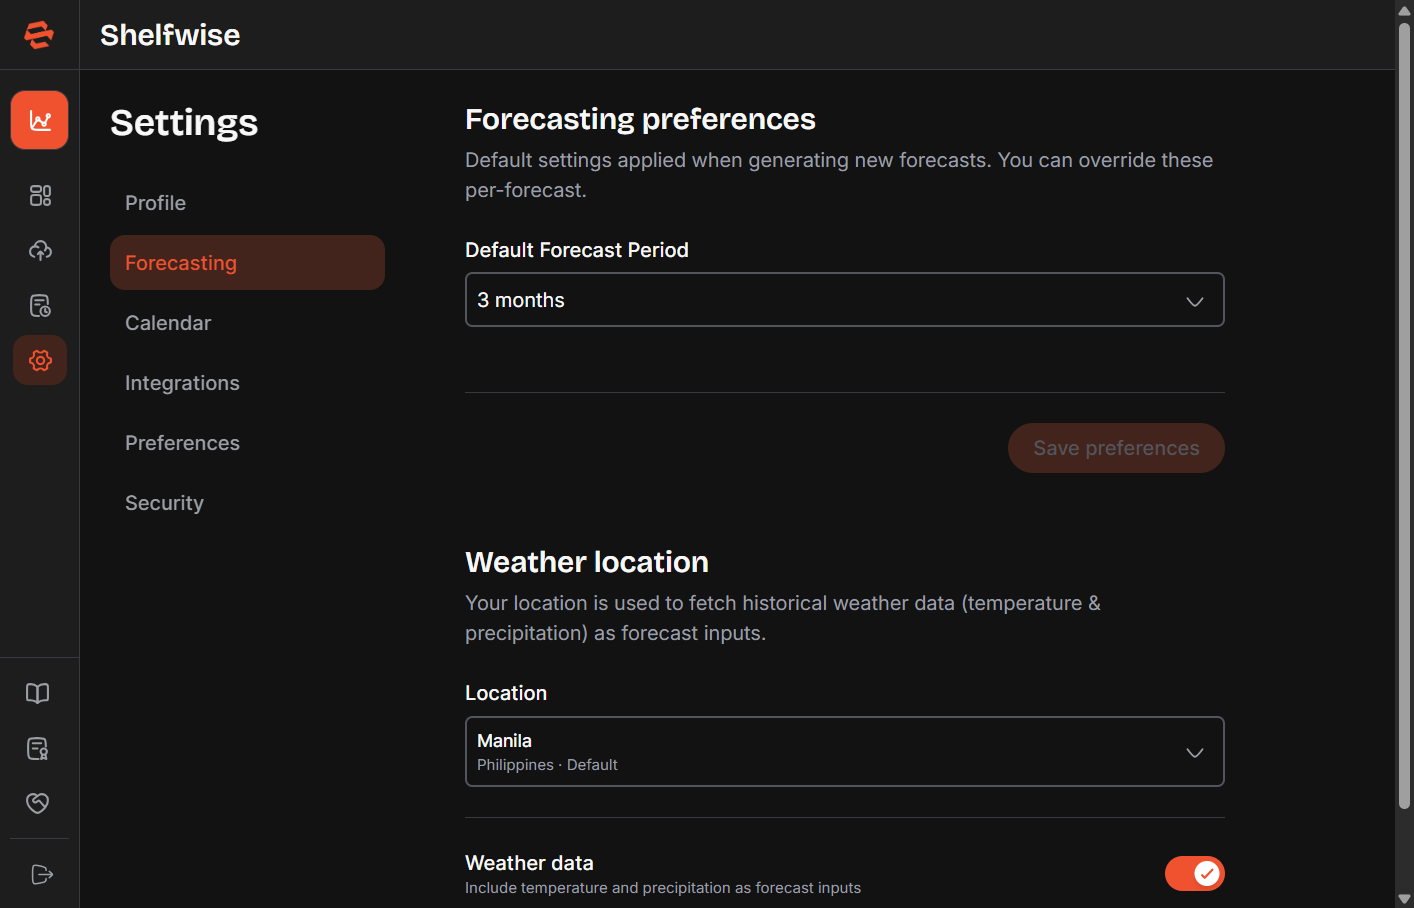
Forecasting
Set default values for new forecasts — preferred model, default horizon, default granularity, and other parameters — so the Generate Forecast panel opens with your most common configuration pre-filled.
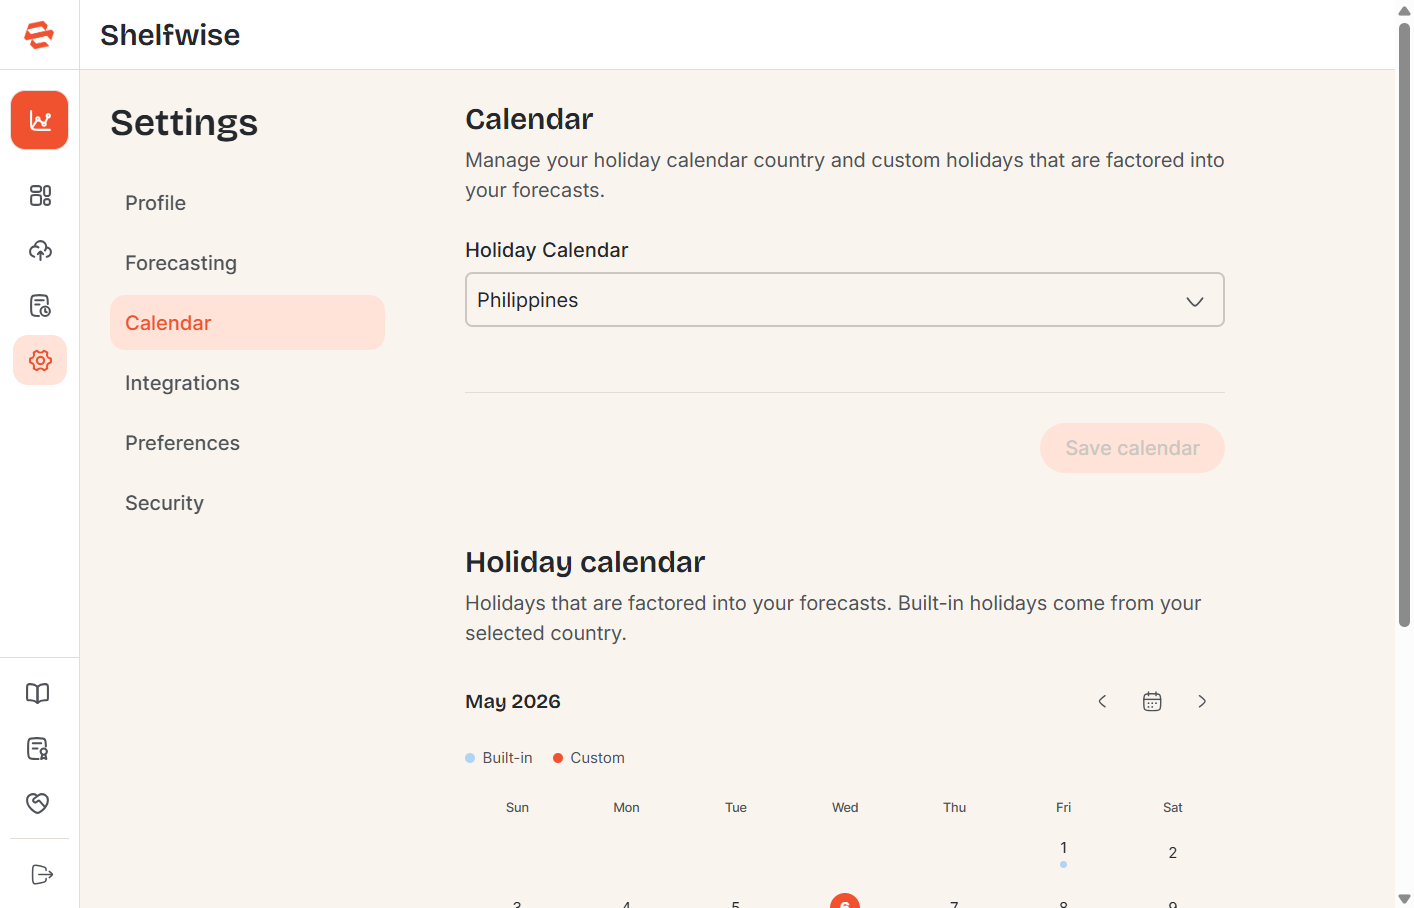
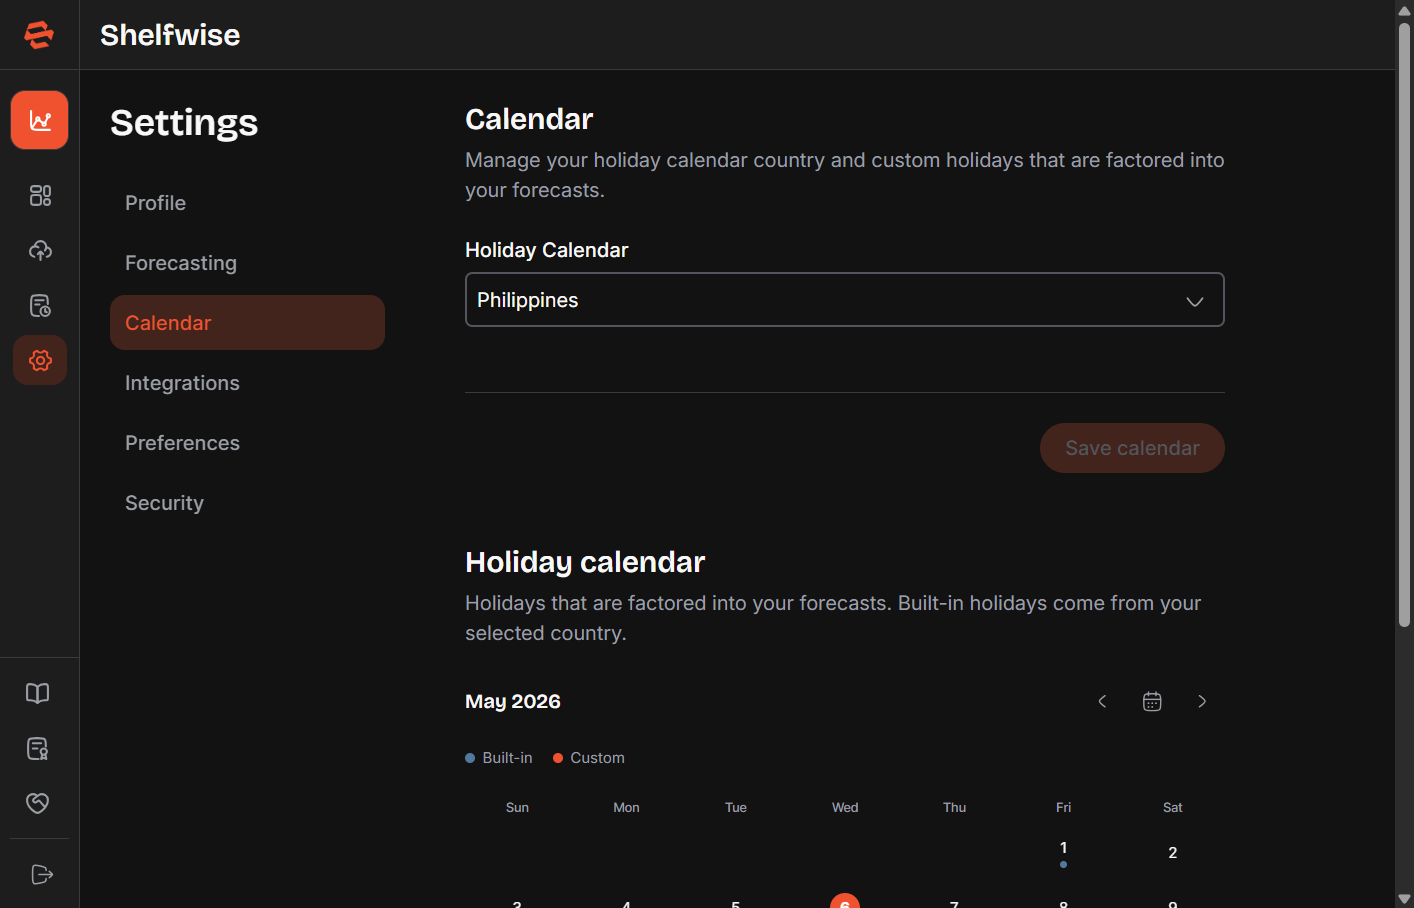
Calendar
Configure which public holiday calendar Shelfwise uses when modelling seasonal demand. Select your country to automatically include national holidays, or add custom holiday dates that are specific to your business.
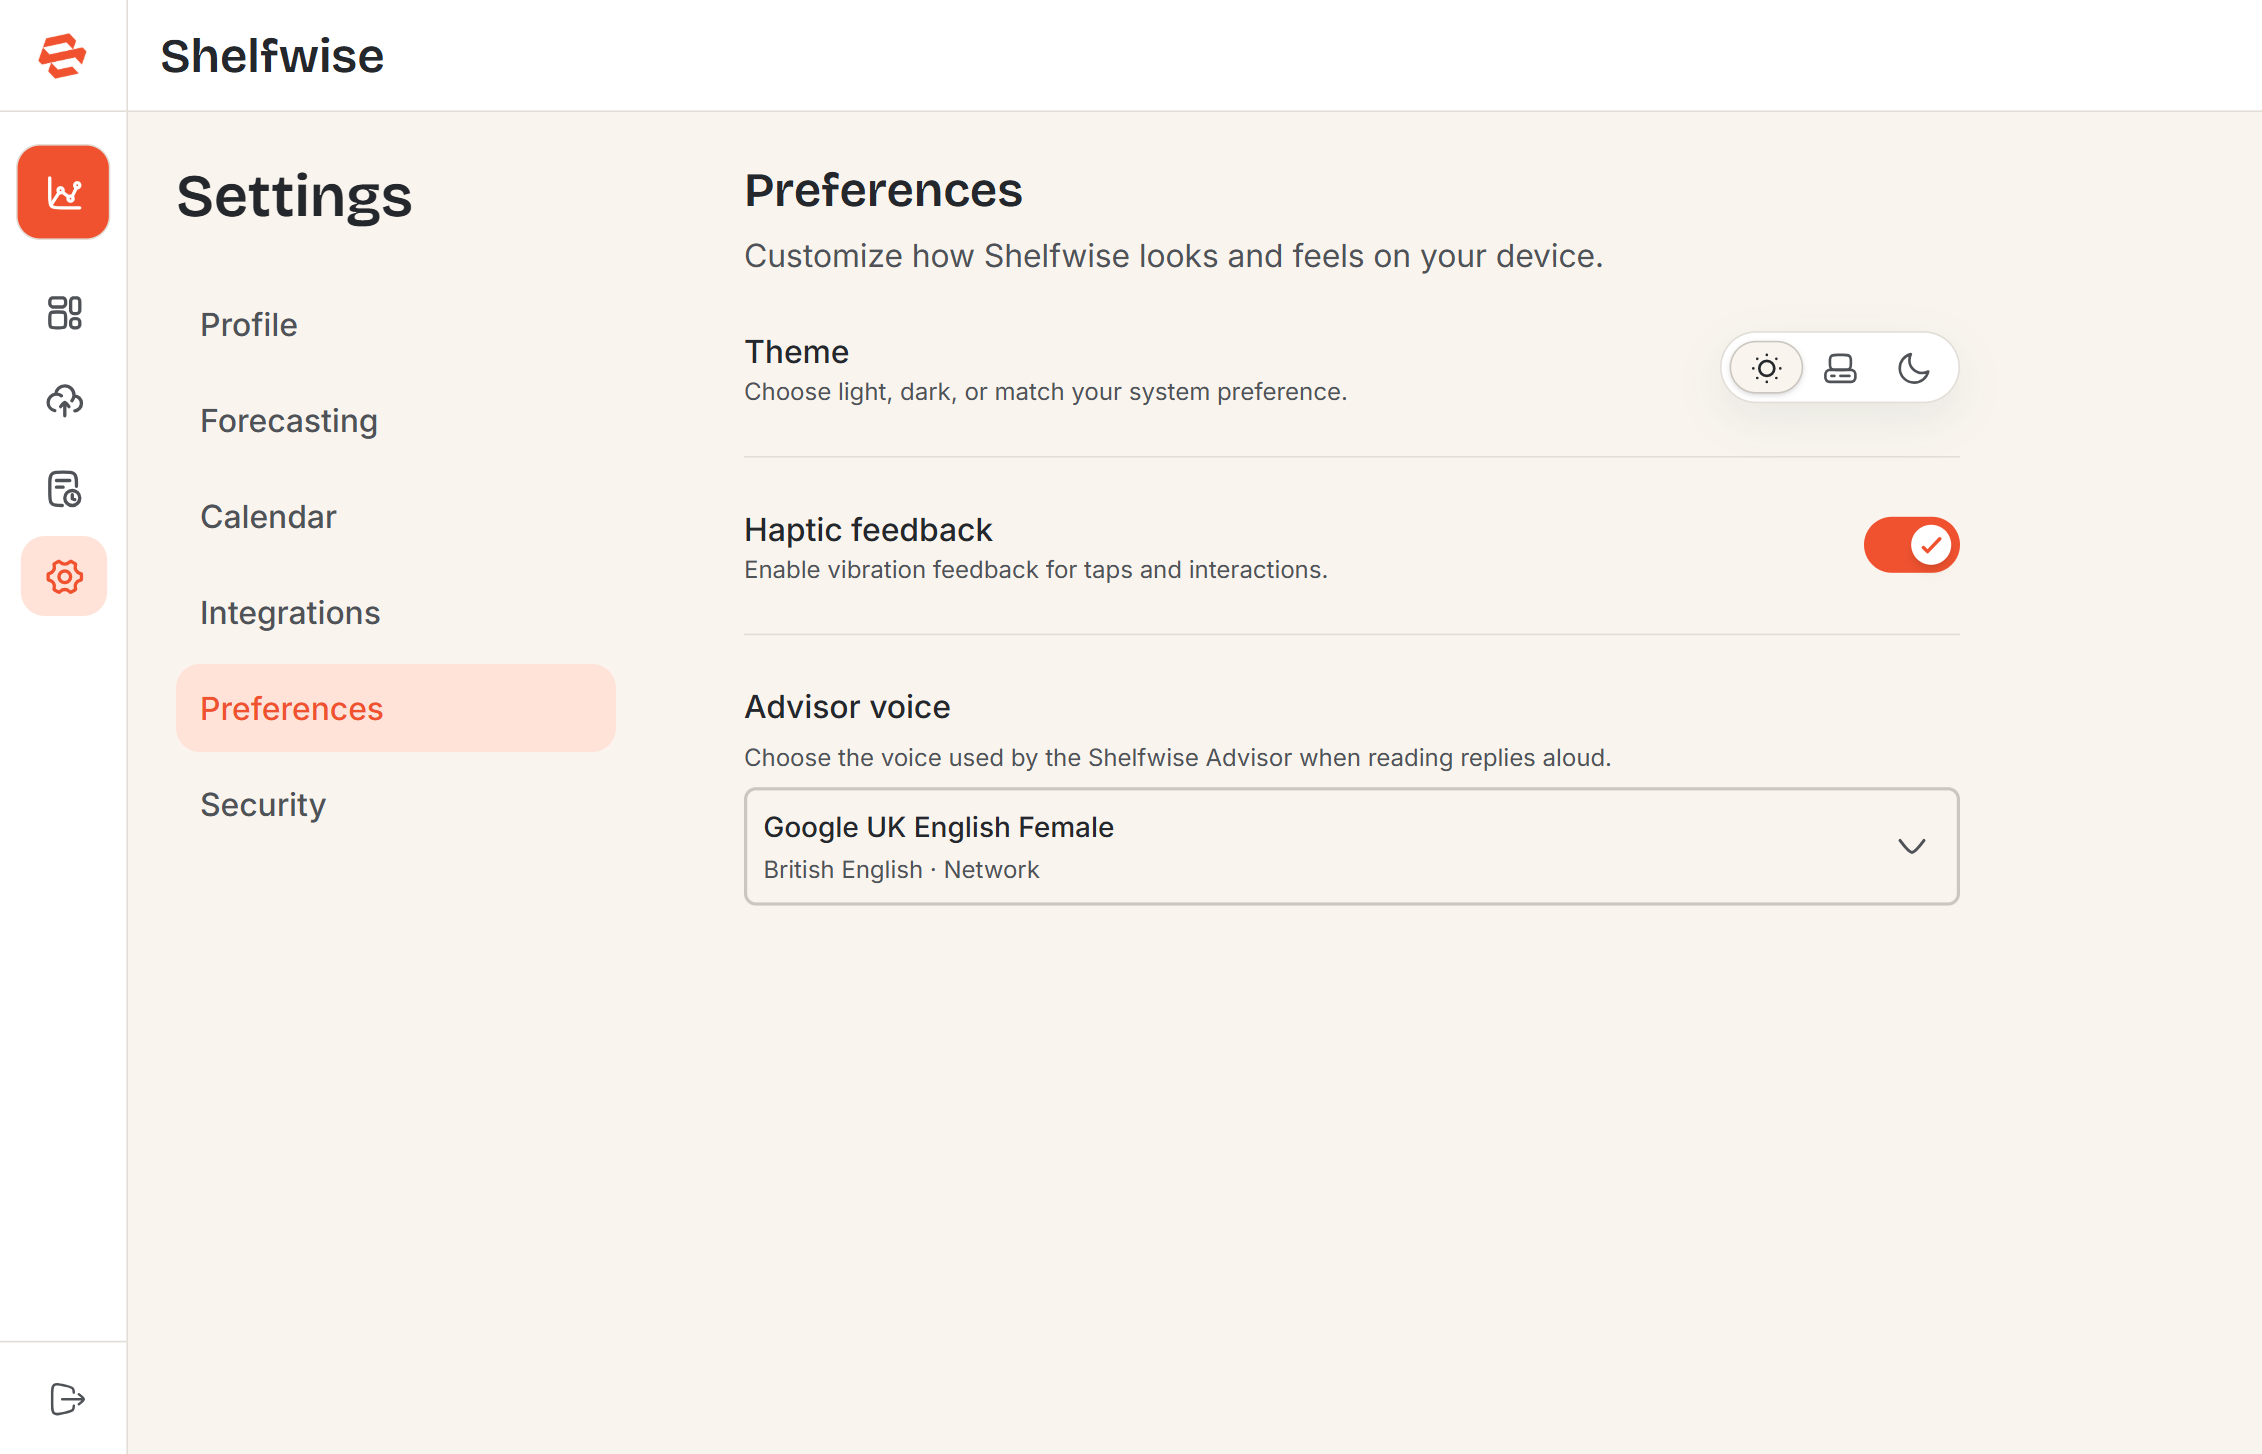
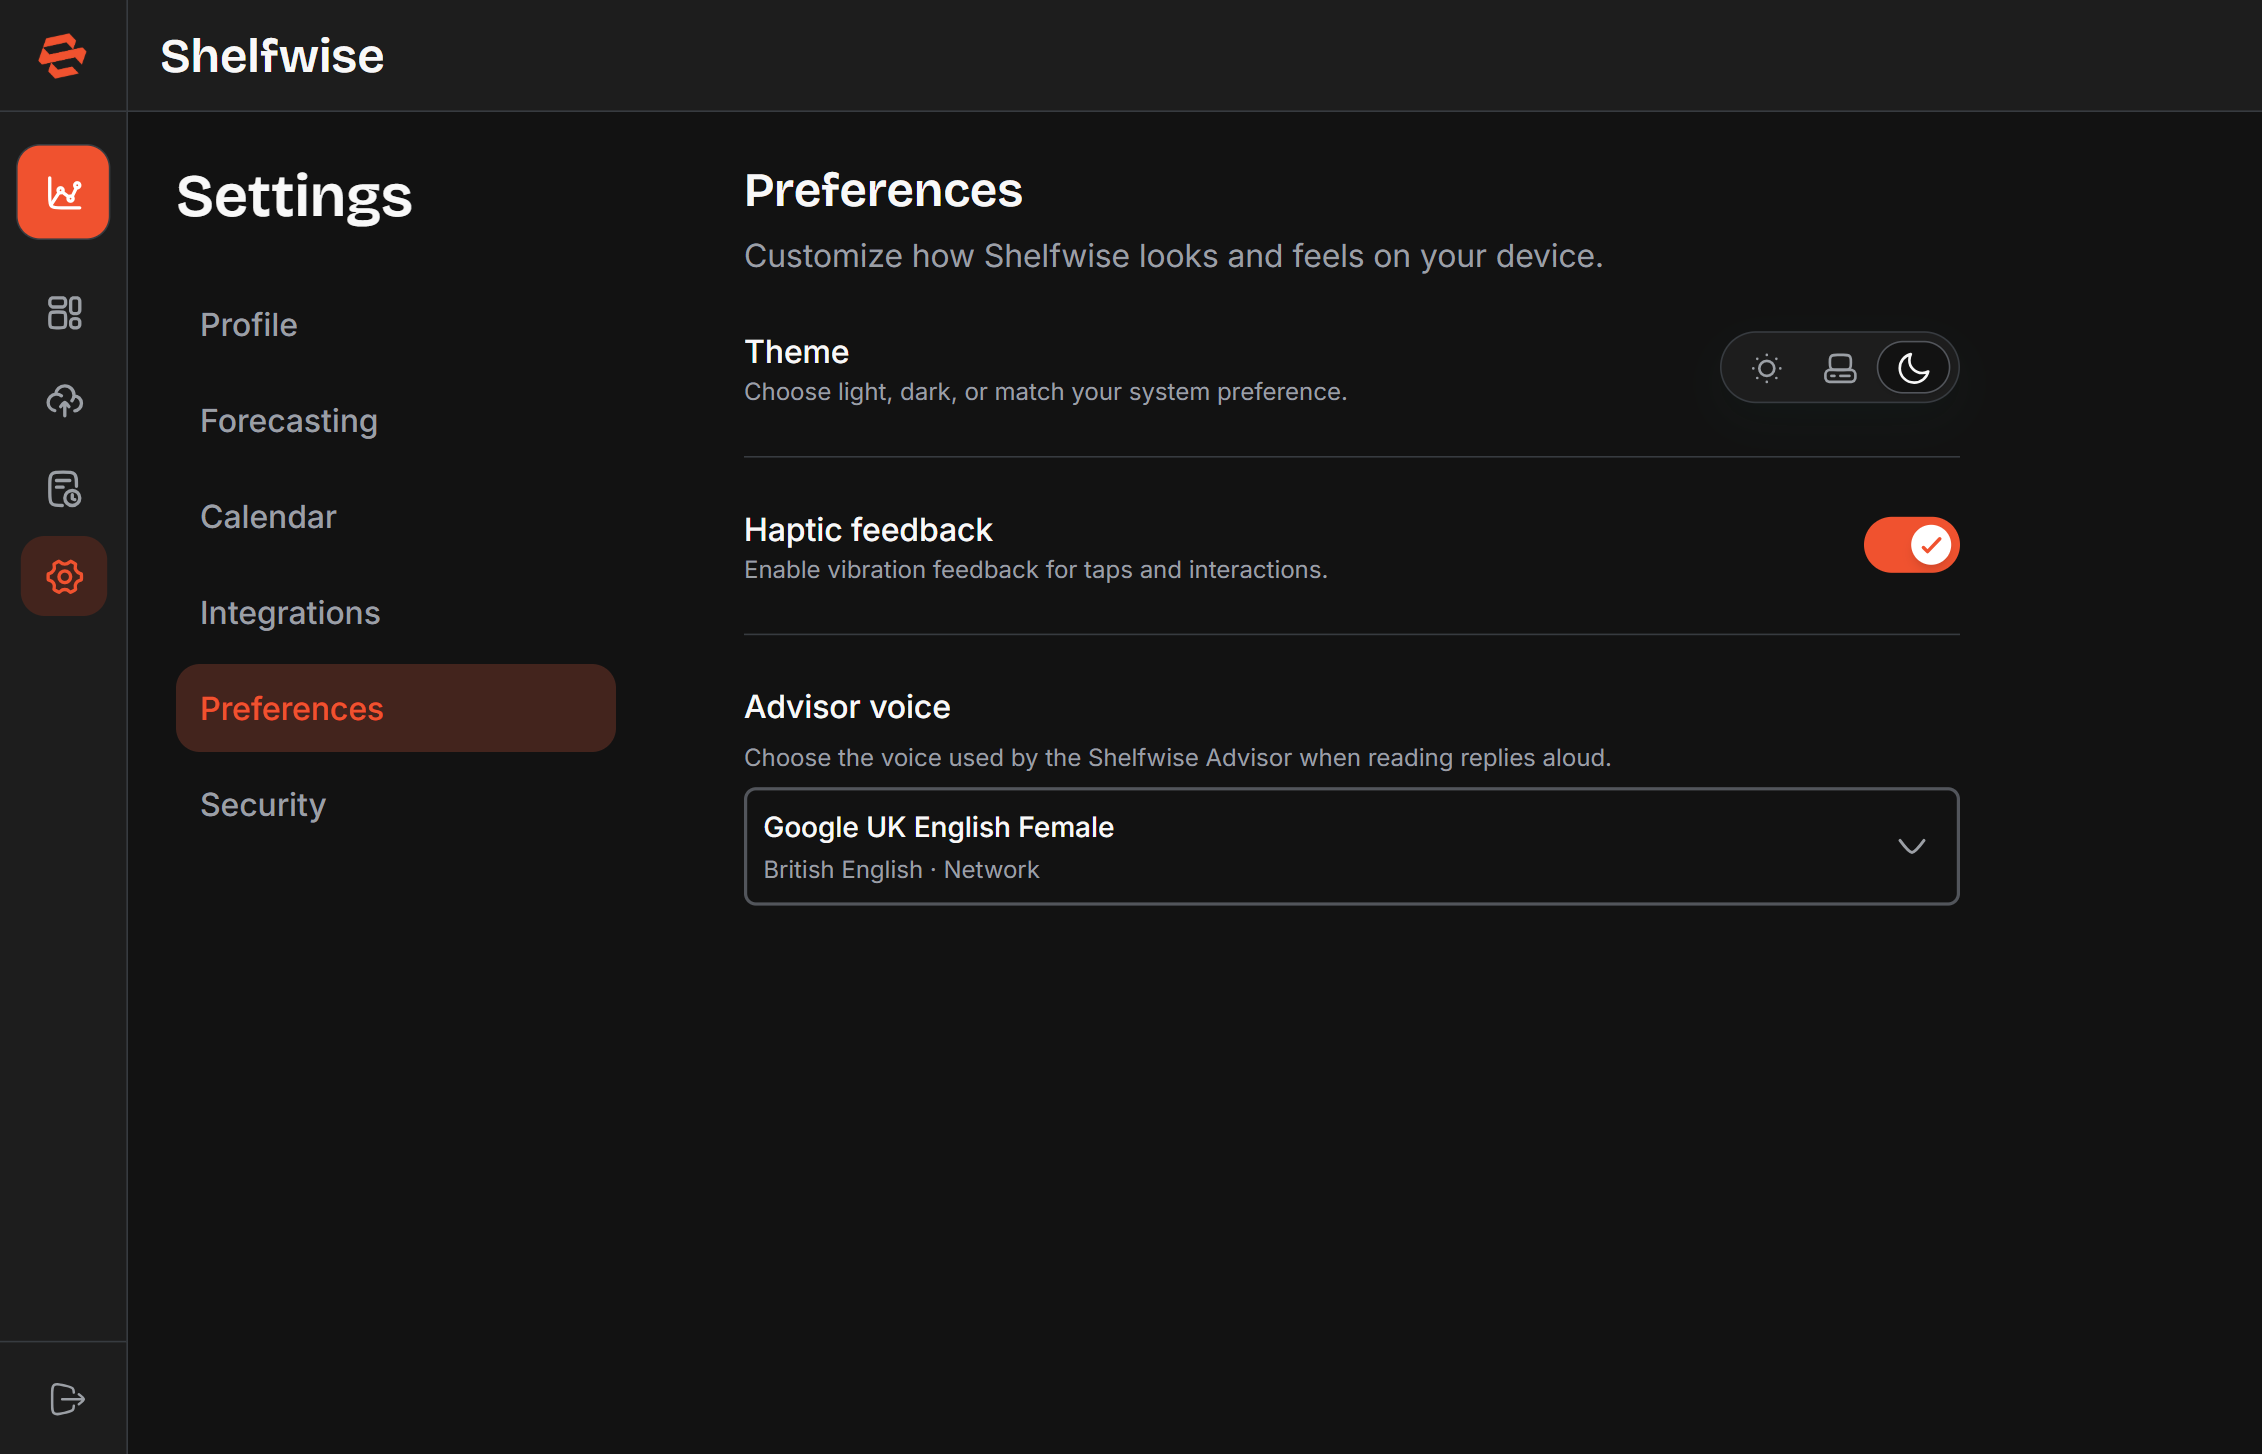
Preferences
Personalise the app appearance and behaviour. Choose between Light, Dark, or Auto (follows your system setting) themes. Additional options include haptic feedback on mobile devices and voice synthesis for accessibility.
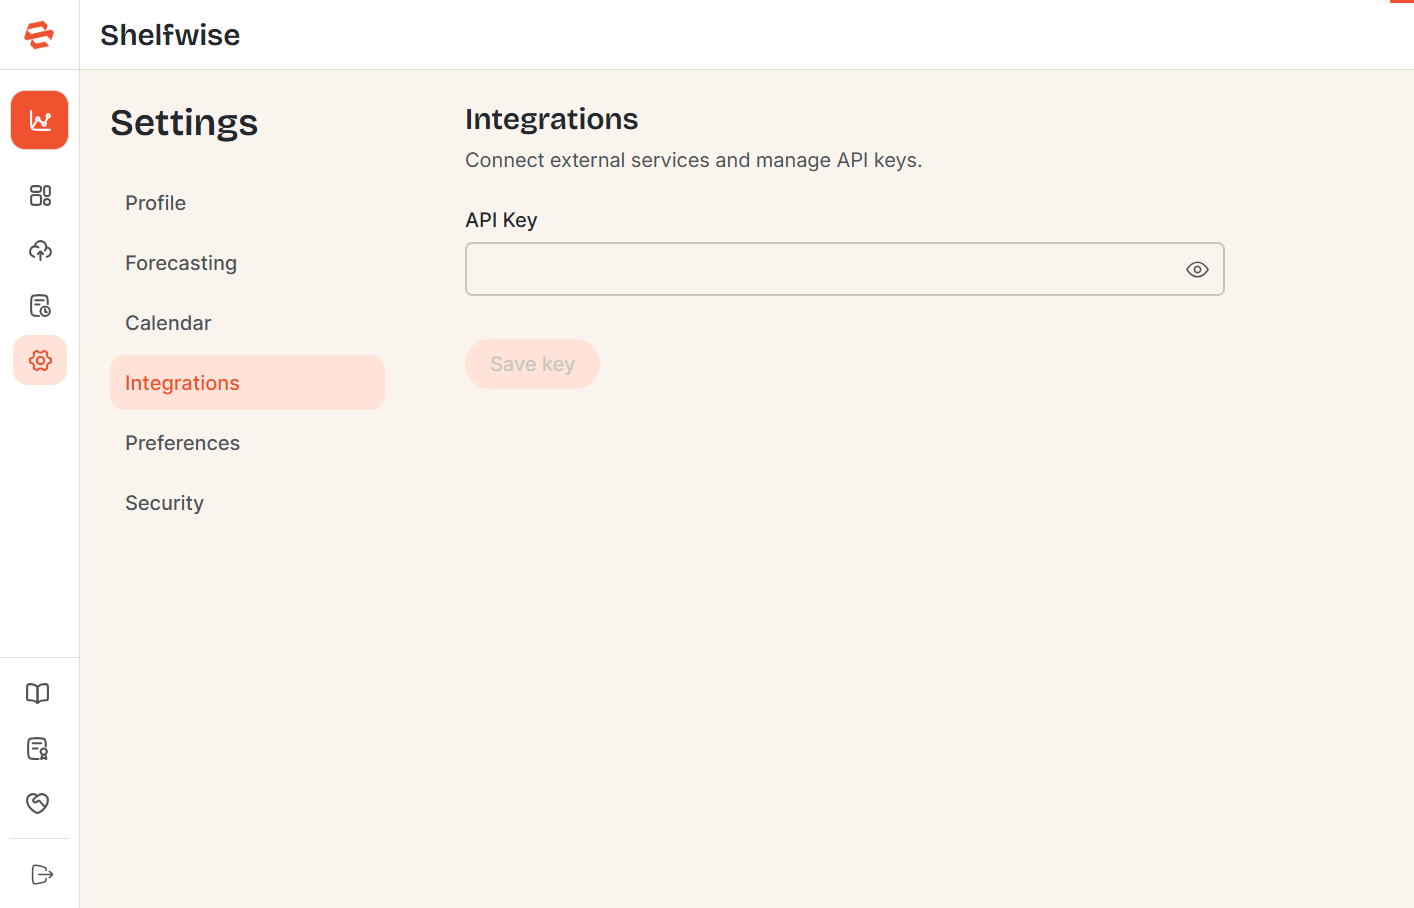
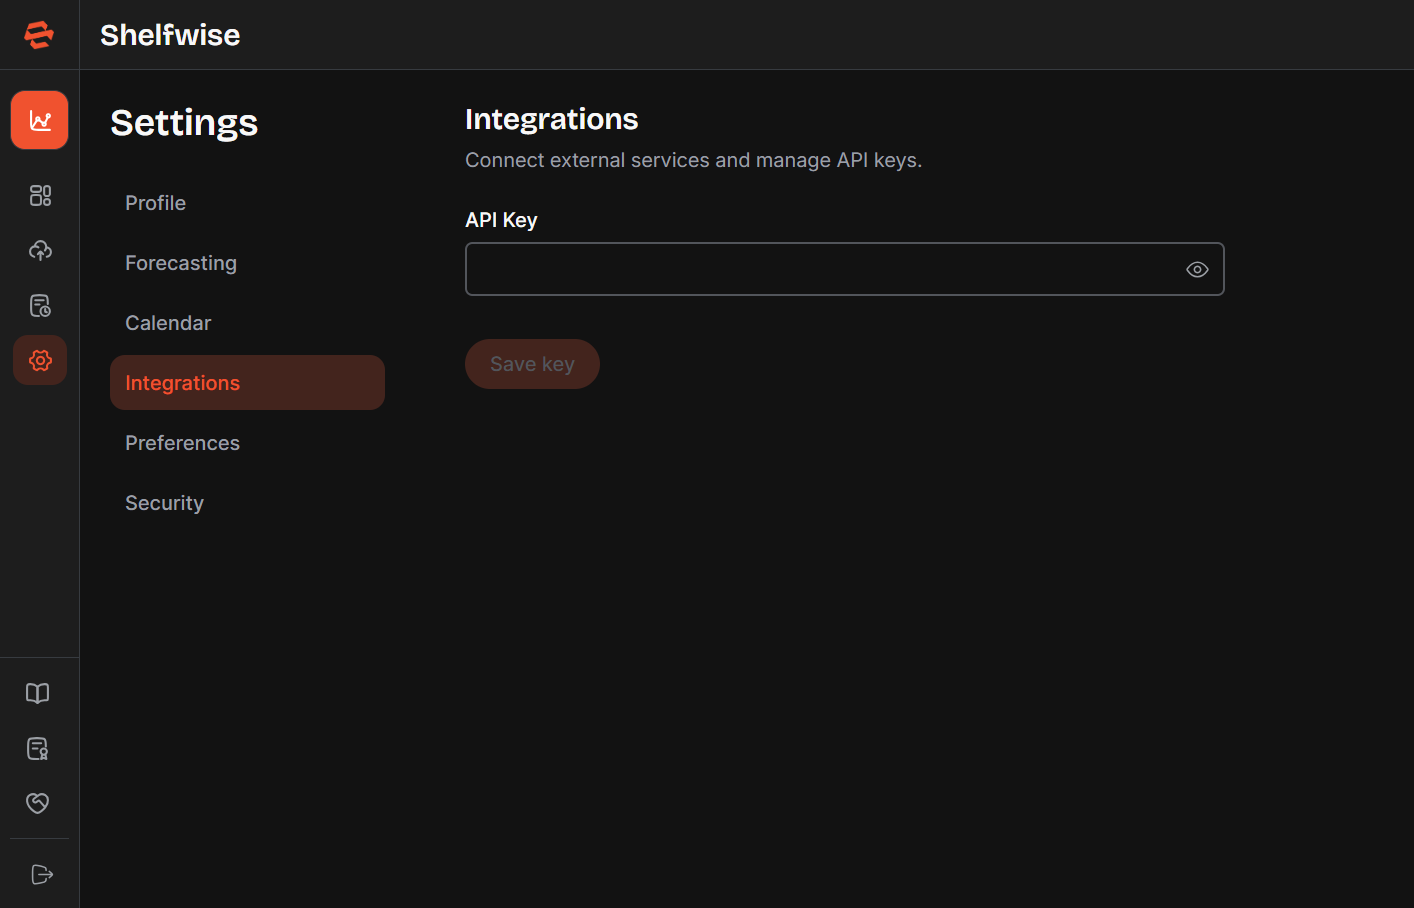
Integrations
Connect external services to enhance Shelfwise. Add your API keys for integrated AI services. Keys are stored securely and never exposed in the interface after saving.
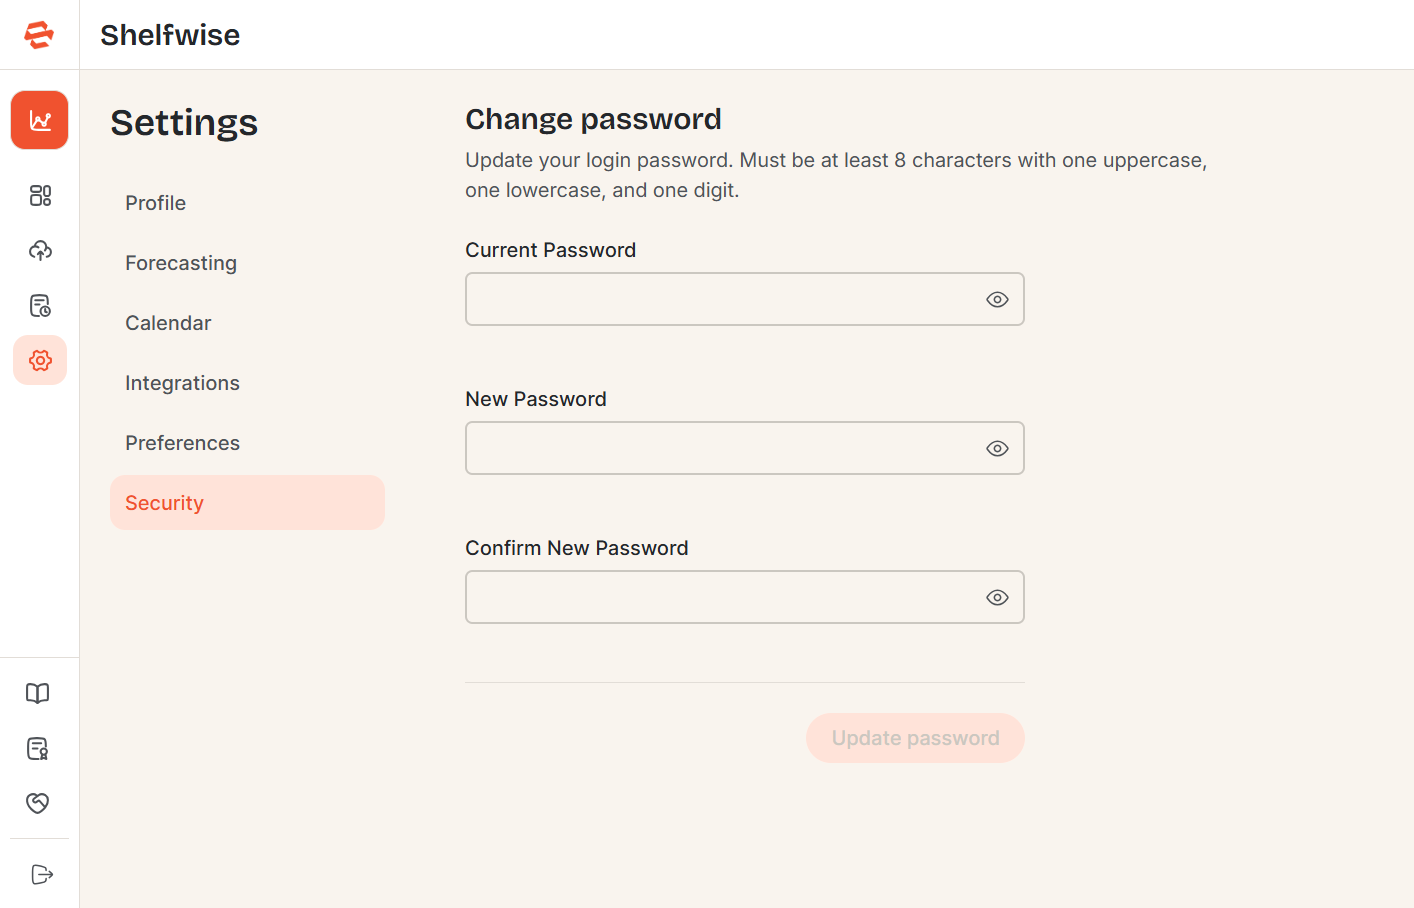
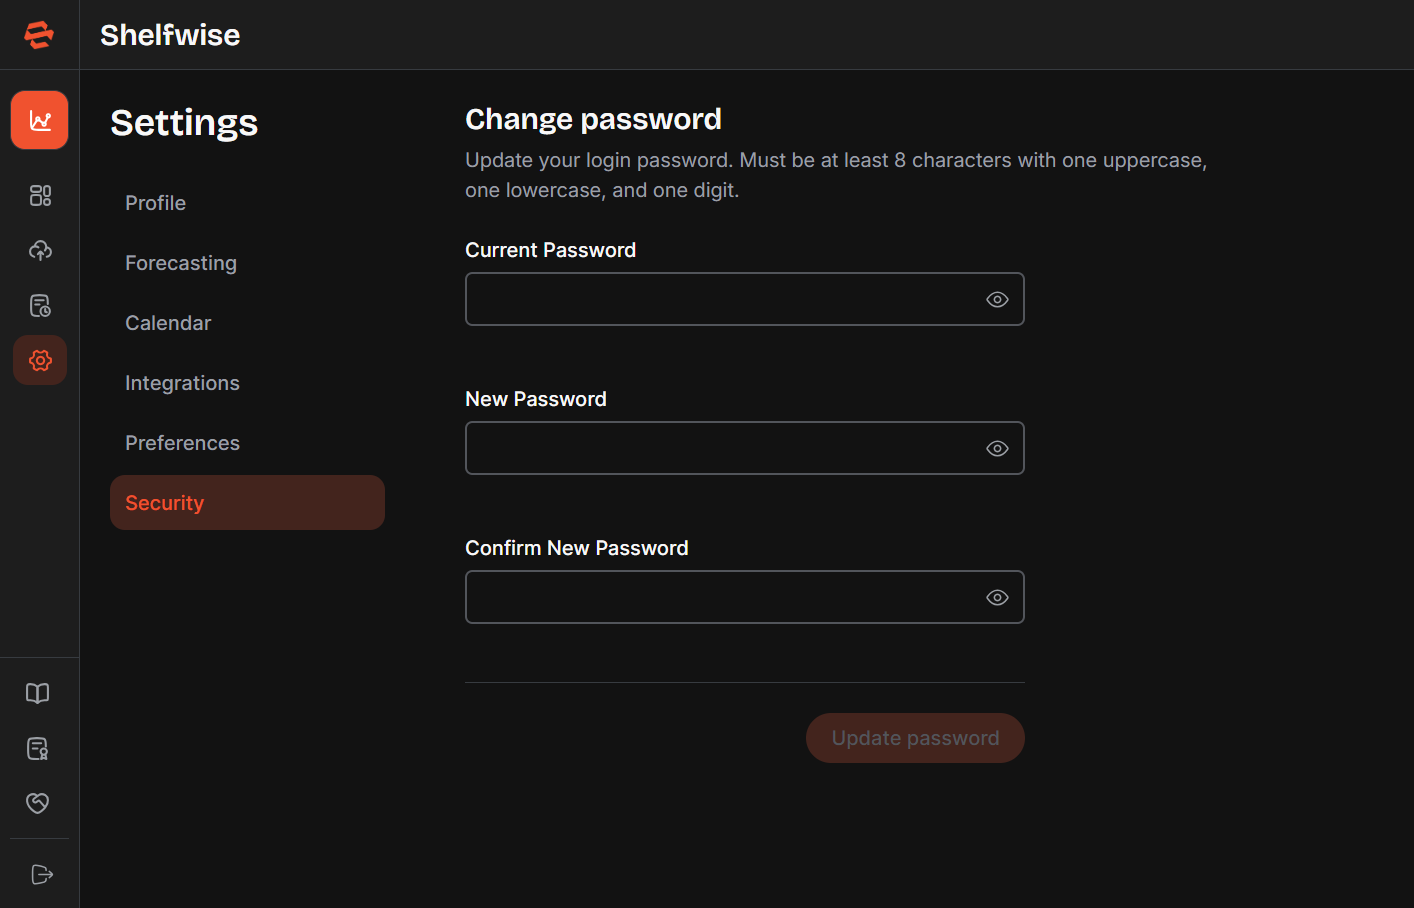
Security
Change your account password from the Security section. Enter your current password and then your new password twice to confirm. If you signed up with Google, password management is handled through your Google account.